|
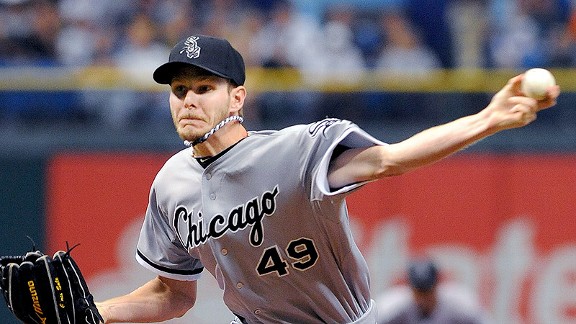
| The best pitchers, like Chris Sale, have low walk rates and high strikeout rates |
For my Econometrics final project, I investigated the determinants of pitcher salaries in an attempt to find measures of pitcher performance that were being undervalued by the market. It's pretty long and involves a lot of detailed explanation about the processes I used (like a lab report), so feel free to scroll down and skip ahead to my conclusions. Here are my findings:
Introduction:
This study investigates the role that certain statistics play in determining the salaries of major league starting pitchers, with the overarching goal of ultimately determining whether some common measures of pitcher performance are being valued properly. By doing so, I hope to reveal market inefficiencies that a general manager could take advantage of. First, I will provide background literature about some common popular and effective measures of pitching performance that I incorporated into my model. Then I will present the variables and statistics that make up my model, describing what each one means and why it is important. After that I will present the results of this study, finding the aggregate model and performing an F-Test to determine whether pooling is appropriate. I expect to confirm the theory that aggregation is inappropriate when analyzing pitchers because the structure of salary rewards varies significantly between the three main groups of pitchers: starters, relievers, and closers (Krautmann, 2003). Therefore, it is likely that I will need to find disaggregate models for each pitcher type as well. Then I can use T-tests to determine the significance of individual statistics on salary. This analysis will allow me to determine what inefficiencies there are, if any, in the labor market for pitchers that a general manager could exploit. I will then identify which statistics are not being valued properly and explain why, given their relationship with team success, they should be valued differently. My hypothesis is that some of the newer sabermetrics, specifically the fielding-independent ones that came into vogue in the early 2000s, will be undervalued whereas traditional metrics like the Triple Crown stats (wins, ERA, and strikeouts) will be overvalued.
Literature Review:
Hall of Fame owner and manager
Connie Mack once said, “Pitching is 75 percent of baseball.” Others have placed an even greater premium on pitching, claiming it to be 90 percent of the game. While such assertions are clearly gross exaggerations, for winning is impossible without scoring runs or playing adequate defense, they still capture the essential belief that pitching is a very important—perhaps the most important—component of baseball. Pundits often say “pitching wins championships,” and generally this is true. Studies have shown runs allowed have a higher correlation with winning percentage than runs scored and that pitching is a better indicator of postseason success than hitting. In fact, only 25 of the 109 World Series champions (22.94 percent) had better hitting than pitching (Paapfly, 2011). It is widely accepted that good pitching is the key to a winning team, so much so that in a recent survey, 44 of 50 baseball experts ranked pitching as the most important factor in winning baseball (Skipper).
Thus, because pitching is valued so highly, free agent pitchers are hot commodities. The market for free agent pitchers is extremely competitive and is only becoming more competitive. Thanks to baseball’s recent influx of TV money and exploding revenues across the sport, teams are becoming richer than ever before. More teams can afford to spend money on free agents, thereby increasing the demand for them (Chen, 2012). But because teams have taken to locking up their young stars with below-market-rate contract extensions (thereby preventing them from reaching the open market in their primes) combined with less production from baseball’s older players (the ones reaching free agency), the supply of available, impact free agents is becoming increasingly limited. With a smaller pool to choose from and more clubs actively pursuing free agents, teams, especially small market teams with tight budgets, need to be smarter than ever before about identifying which players are worth adding to their payroll (Sawchik, 2013).
The best way to do that is through statistical analysis, once an innovative idea now commonplace throughout the sport in large part because of Michael Lewis’s landmark book
Moneyball and the success of analytical teams such as the A's, Red Sox, and Rays (Hakes and Sauer, 2006). And while there are numerous available statistics to measure a pitcher’s prowess, only a handful of them reflect his true skill set. This theory, known as Defense-Independent Pitching Statistics (DIPS), was popularized by Voros McCracken in 2001when his research revealed that the amount of balls that fall in for hits against pitchers do not correlate well across seasons. He concluded that pitchers have little control over balls in play—a conclusion that has since been verified by multiple studies within the sabermetric community—and argued for stats that leave such events out of their calculations. These statistics—walks, strikeouts, home runs, and hit by pitches—are designed to separate out defense and luck from measures of pitching performance, simply quantifying how well a pitcher controls the strike zone. Thus, they are widely believed to be best tools for evaluating pitchers. While not perfect, they help eliminate a lot of statistical white noise and are better predictors for future performance than previous ERA (Basco and Davies, 2010). Accordingly, I included defense-independent statistics such as walk rate (BB/9), home run rate (HR/9), strikeout rate (K/9), strikeout-to-walk ratio (K/BB), and Fielding Independent Pitching (FIP) to determine their effect on pitcher salaries. Since McCracken’s theory has been hailed by the sabermetric community as one of the most important baseball research discoveries in recent times (Bradbury, 2005), these variables should have some effect on salary. However, since DIPS is relatively new given the data set, which extends back to 1985, it’s possible that these variables won’t be significant.
These statistics do a much better job reflecting a player’s performance than traditional metrics, which are flawed because they rely too much on the performance of the pitcher’s teammates. When evaluating individual players, the goal should be to isolate him from his teammates as much as possible to get a clearer picture of his skill set, and traditional metrics don’t do this particularly well. Wins, for example, are heavily dependent on run support, sound defense, strong bullpen work, and a competent manager, none of which a pitcher can control. Historically, though, a high premium has been placed on wins, particularly for starting pitchers. Racking up 300 career wins has traditionally guaranteed entry into the Hall of Fame (unless you're
Roger Clemens) and pitchers that win 20 games in a single season usually receive strong
Cy Young consideration. For example, going back to 1985, 20 of the past 29 American League Cy Young recipients were 20-game winners (Baseball-Reference) . Because wins have traditionally been given a lot of weight when evaluating pitchers, I included Win-Loss ratio (defined as WLrate) in my model with the expectation that it would be a significant determinant of salary, even though it shouldn’t be.
Similarly, another old-school statistic, earned run average (ERA), has historically been considered the best measurement of a pitcher’s talent. As a measure of run prevention, it supposedly measures a pitcher’s ability to keep his team in the game. However, ERA has recently been exposed as a flawed statistic because what constitutes an error, and thus the difference between an earned run and an unearned run, is up to the discretion of the official scorer. Furthermore, ERA depends heavily on the defensive ability of the pitcher’s team, as balls that his fielders can’t reach aren’t counted as errors (Moore, 2009). But since ERA is still highly valued I included it in my model and expected it to be a significant determinant of salary.
The biggest determinant of ERA—a relatively new sabermetric called WHIP—is a better indicator of a pitcher’s effectiveness. Though it’s partially a team-statistic because it takes hits, which are susceptible to luck and defense, into account, WHIP is regarded as the most important determinant of pitcher salaries. Calculated as the sum of walks and hits divided by innings pitched, WHIP measures how often a pitcher allows runners to reach base. Since more runners lead to more runs scored by the opponent, WHIP is highly correlated with ERA (FanGraphs). In addition to increasing the other team’s run expectancy, baserunners force the pitcher to alter his delivery and pitch from the stretch, which typically reduces his velocity and makes his pitches easier to hit. Generally speaking, then, the most effective pitchers are the ones that prevent runners from reaching base. WHIP is also, according to a study done by economist Adam Houser, the most important statistic for determining team success (Houser, 2005), which explains why WHIP “is the chief determinant of how much the GM wants (a pitcher)…if the pitcher’s WHIP increased by .1, his salary will decrease by 37.7%...WHIP is the most important factor in determining a player’s salary” (Costa, 2012). Expecting WHIP to be a significant determinant of salary, I included it as a variable in my model to see if this was true.
When constructing my model I also had to take into account the different salary structures between the different subsets of pitchers. Past studies have proven that pitchers are paid differently because they are used differently, by which I mean used in different situations and for different lengths of time. History shows that starters, because they pitch the most and are inherently more valuable, make the most money, followed by closers (who are typically called upon to pitch in high leverage situations when the team is holding a lead in the ninth inning), then relievers. It’s also important to consider that statistics are not valued equally between the groups. For instance, wins are more important for starting pitchers and saves are more important for closers. Thus, it has been proven that using an aggregate model for analyzing salary determinants of pitchers is not appropriate and will lead to inaccurate conclusions (Krautmann, 2003). Later in this paper I will implement an F-test to see which model is more appropriate, but I expect to agree with Krautmann’s analysis that aggregation is inappropriate and will therefore need to construct disaggregate models.
Data Description:
My basic model follows a semi-log function:
Ln(salary) = B0 + B1WHIP + B2KBBratio + B3ERA + B4HRrate + B5BBrate + B6Krate + B7WLrate + B8FIP + B9IP + B10YearsinMLB+ B11YearsinMLBsquared + e
All of the variables in this model are baseball statistics and the data used to calculate them came from the Lahman baseball database. I used career statistics because general managers typically pay attention to a player’s entire body of work instead of just his most recent season, which could have been a fluke year or been cut short by injury. I also used rate stats instead of raw totals to account for workload discrepancies and better compare the different pitcher types, since starters typically throw more innings and thus have superior counting stats. Lastly, I chose stats that could be applied to all three pitcher groups, leaving out metrics like saves which generally only apply to closers and wouldn’t be helpful in determining the salaries of starting pitchers or relievers. Each variable is described in detail below:
Ln(salary): My salary variable is the salary of the pitcher measured in dollars. I’m using the natural log of salary to reduce the effect of extreme outliers on the model.
WHIP: Walks and hits per innings pitched is regarded as one of most important pitching stats, especially as a determinant of salary. WHIP is a measure of the pitcher’s ability to limit baserunners and is calculated as (Walks + Hits)/Innings Pitched. However, because it takes hits into account and hits are influenced by the defense as well as luck, WHIP values are prone to fluctuating and are not defense-independent (FanGraphs).
KBBratio: The ratio of a pitcher’s strikeouts to walks (strikeouts/walks). The ratio of strikeouts to walks is a good measure of a pitcher’s command and is also defense-independent. The pitchers with the best ratios are usually aces (
Pedro Martinez,
Curt Schilling) and elite relievers/closers (
Mariano Rivera,
Craig Kimbrel) (Heretz, 2014).
ERA: Earned run average is one of baseball’s oldest and most popular pitching stats. It is calculated as (Earned Runs Allowed/Innings Pitched)*9 and reflects a pitcher’s ability to keep the other team from scoring. ERA does, however, depend on a number of factors beyond the pitcher’s control, such as the defense behind him as well as his bullpen. If a starter leaves runners on base when he comes out the game and the reliever that replaces him allows them to score, those runs will be charged to the starter because he put them there.
HRrate: Home run rate. Home runs per 9 innings pitched (9*HR/IP) is measures a pitcher’s ability to keep the ball in the park. This is crucial because a home run is an automatic score, making it the most efficient way for the other team to score runs. A home run can score up to four runs—depending on how many runners are on base—with one swing of the bat , thus making it a devastating weapon for the offense. A pitcher’s ability to limit the long ball, either by limiting mistake pitches over the plate or keeping the ball low in the zone, is vital to his success. However, it’s important to note that home run rates are not very stable and can vary depending on the ballpark and weather conditions. Nevertheless, home runs appear to be strongly linked to a pitcher’s skill set (Paine, 2014).
BBrate: Walks per 9 innings pitched (9*BB/IP) is a measure of a pitcher’s control and is also valued because it is a defense-independent stat. A lower walk rate means a pitcher has sharper command, is using his pitches efficiently, and is avoiding giving away free bases to batters.
Krate: Strikeouts per 9 innings pitched (9*K/IP). Strikeouts are important because they take pressure off the defense and are helpful for getting out of jams, when there are multiple baserunners with less than two outs and a batted ball has a greater probability of scoring a run. Usually the pitchers with the highest velocity or most unhittable pitches have the best strikeout rates. Like walk rate, K/9 is a defense-independent stat.
WLrate: A pitcher’s win-loss ratio is a general measure of a team’s success when he is on the mound (measured as Wins/Losses). It matters more for starting pitchers because relievers and closers typically only get a handful of wins and losses in a given season. However, a pitcher’s record is extremely dependent on the team’s offensive, defensive and bullpen abilities and fails to accurately reflect a pitcher’s ability.
FIP: Fielding Independent Pitching is probably the best defense-independent and pitching metric because it uses strikeouts, walks, and home runs to approximate ERA without the effect of a team's fielding ability, thus reflecting what a pitcher’s ERA should have looked like over a given time period (assuming that performance on balls in play and timing were league average). FIP actually correlates to future ERA better than ERA itself because it incorporates walk and strikeout rates (which are predictable), making it a superior indicator of future performance. It is calculated as FIP = ((13*HR) + (3*(BB + HBP)) - (2*K))/IP + constant. The constant’s purpose it to bring FIP onto an ERA scale and is generally around 3.20, which I used for my calculations. The logic behind FIP is that a walk is not as harmful as a home run and a strikeout has less impact than both, since it is only a way of specifying outs. FIP accounts for these kinds of differences, but because of the weight placed on home runs it is better suited for starters than relievers and closers, who pitch fewer innings and are thus more susceptible to fluky home run rates (FanGraphs).
IP: A pitcher’s innings pitched total is a good measure of his durability and is important for long relievers and starters. Long relievers need to be able to pitch multiple innings when the starter has been removed from the game early. Starting pitchers, as the best pitchers on the team (relievers are almost always failed starters), need to pitch deep into games to preserve the bullpen and prevent the manager from relying on less-effective pitchers.
YearsinMLB and YearsinMLBsquared: These two stats measure a pitcher’s experience. I included the squared variable to account for the fact that sometimes the relationship between experience and salary is not linear. In fact, it is usually the shape of a bell curve because a player’s salary is suppressed early in his career when he has little bargaining power, peaks when he reaches free agency and declines toward the end of his career when his durability and skills diminish. Squaring YearsinMLB presents experience as a linear relationship.
Dummy Variables: The lahman database provides data from the 1985 season through the 2012 season. I compiled my data using year dummies from 1985 through 2011 in both the aggregate and disaggregate models, omitting the 2012 season to avoid collinearity. In the aggregate model I included starters, closers, and relievers as dummy variables, but dropped them from the disaggregate models. I replaced them with the clause “if starter==1” for the disaggregate starter model, “if reliever==1” for the disaggregate reliever model, and “if closer==1” for the disaggregate closer model.
Except for the starter, closer, and reliever dummies, my disaggregate models used the same variables as my aggregate model. It is also important to note that I did not include pre-arbitration eligible players in the model because they are unable to negotiate their salaries, which are usually close to the league minimum regardless of their talent level. A player is typically arbitration-eligible after his third year in the league, at which point he and his team can negotiate salaries agreed upon by an arbitrator. It is generally believed that arbitration players are paid close to what they would make in free agency, which a player becomes eligible for after his sixth season. Therefore, in order to exclude the statistics of any pitcher who had not been in the league for 3 years I included an “if YearsinMLB>3” clause in each regression.
Lastly, in this data it was implied that the pitchers signed new deals every year.
 |
| Inexperienced pitchers like Jose Fernandez are excluded from the model |
Results & Analysis:
My aggregate and disaggregate results are summarized in the following tables:
Table 1: Summary statistics
Variable
|
Observations
|
Mean
|
Stand. Dev.
|
Min
|
Max
|
lnsalary
|
5429
|
14.11337
|
1.144147
|
8.853665
|
17.0054
|
WHIP
|
8223
|
1.382458
|
.1423192
|
.8507463
|
2.543478
|
KBBratio
|
8223
|
1.909423
|
1.909423
|
.3823529
|
5.631579
|
ERA
|
8223
|
4.148665
|
.8213179
|
1.83913
|
13.5
|
HRrate
|
8223
|
.9356626
|
.2852701
|
.1615154
|
4.21875
|
BBrate
|
8223
|
3.534886
|
.9059441
|
.8059701
|
10.5859
|
Krate
|
8223
|
6.447733
|
1.55695
|
2.571429
|
14.01581
|
WLrate
|
8195
|
1.07005
|
.4840408
|
0
|
9
|
FIP
|
8223
|
4.394036
|
.6054866
|
2.104645
|
10.325
|
IP
|
8223
|
820.4798
|
746.6007
|
10.66667
|
5404.333
|
YearsinMLB
|
8223
|
7.872796
|
3.720746
|
4
|
27
|
YearsinMLBsq.
|
8223
|
75.82318
|
79.17193
|
16
|
729
|
Table 2: Regression Estimates of
ln(salary) aggregated
Variable
|
Coefficient
|
T-stat
|
constant
|
15.31789
|
5.14*
|
WHIP
|
-2.027589
|
-2.96*
|
KBBratio
|
-.0488592
|
-0.28
|
ERA
|
-.6327169
|
-5.89*
|
HRrate
|
.3231463
|
.28
|
BBrate
|
.0890629
|
.30
|
Krate
|
.0527978
|
.27
|
WLrate
|
.023157
|
.30
|
FIP
|
-.1939498
|
-.24
|
IP
|
.005932
|
6.97*
|
YearsinMLB
|
.4000347
|
6.38*
|
YearsinMLBsquared
|
-.0140668
|
-12.02*
|
Observations
|
5420 (1192
clusters)
|
|
*means significant at the 10% level
Table 3: Regression Estimates of
ln(salary) disaggregated
|
Starter
|
Reliever
|
Closer
|
Variable
|
Coefficient
|
T-stat
|
Coefficient
|
T-stat
|
Coefficient
|
T-stat
|
constant
|
14.85378
|
1.86*
|
15.46193
|
4.50*
|
32.54965
|
5.78*
|
WHIP
|
-.6996197
|
-.43
|
-2.452978
|
-3.13*
|
-1.979439
|
-1.39
|
KBBratio
|
-.3232786
|
-1.27
|
-.5813874
|
-1.74*
|
.2098917
|
.62
|
ERA
|
-.7952905
|
-3.62*
|
-.4778334
|
-3.96*
|
-.4136421
|
-1.81*
|
HRrate
|
.4035439
|
0.13
|
-1.53266
|
-1.87*
|
7.029692
|
2.68*
|
BBrate
|
-.2913997
|
-.38
|
-.4363638
|
-1.13
|
1.984496
|
2.76*
|
Krate
|
.2365876
|
.48
|
.3907144
|
1.51
|
-1.156296
|
-2.64*
|
WLrate
|
.2771034
|
2.31*
|
.045552
|
.56
|
-.1765087
|
-2.86*
|
FIP
|
.3178841
|
.15
|
.9299749
|
.93
|
-5.329965
|
-2.96*
|
IP
|
.001518
|
6.87*
|
.0007396
|
3.09*
|
.0018258
|
6.55*
|
YearsinMLB
|
.1290625
|
.84
|
.4015625
|
4.99*
|
.1144147
|
.68
|
YearsinMLBsquared
|
-.1039217
|
-9.45*
|
-.148052
|
-7.19*
|
-.0141254
|
-4.69*
|
Observations
|
2243 (522
clusters)
|
2161 (873
clusters)
|
1017 (343
clusters)
|
* means significant at the 10%
level
In my aggregate model I performed T-tests on each variable. Using a 10% significance level with infinite degrees of freedom, the critical region was greater than 1.645 and less than -1.645. Working under the null hypothesis that each variable equals zero and has no influence on salary, I was able to reject the null for the variables WHIP, ERA, IP, YearsinMLB and YearsinMLBsquared. By rejecting the null hypothesis I disproved the notion that these variables have no influential power and are not determinants of salary, but my inability to reject the other variables means I cannot disprove their lack of influential power. However, because my research showed that the other variables are likely to affect salary as well, I chose to include the variables BBrate, Krate, KBBratio, FIP, and WLrate in my model.
Aggregate vs. Disaggregate models: To determine if aggregation of the different pitcher types was necessary, I implemented an F-test on the pooled model at the 5% significance level. The resulting F-stat of 2.78 exceeded the critical value of F>1.00 (infinite degrees of freedom in the numerator and denominator), allowing me to reject the pooled model at both the 5% and 1% significance levels. Thus, I found strong evidence of structural differences and concluded aggregation was not appropriate. To make valid conclusions about determinants of salary I used disaggregate models for starters, relievers, and closers. These models allowed me to isolate how the variables influenced salary in each of the three markets and compare differences.
Starter Model: Performing T-tests on this group showed me that ERA, WLrate, IP, and YearsinMLBsquared were significant at the 10% level. The T-statistic for KBBratio suggested it may also be significant. This confirms my belief that traditional statistics have more influence on a starter’s salary than defense-independent statistics. Durable starting pitchers with low ERAs and good win-loss records fit into the traditional ace mold and are rewarded accordingly (i.e.
Clayton Kershaw and
CC Sabathia). W-L rate in particular is overvalued since it is too dependent on factors beyond the pitcher’s control and is not a good measure of his abilities.
I was very surprised that FIP’s T-stat was nowhere close to that of ERA, given that FIP is actually a better predictor of future ERA. Arguably the best statistic for measuring a starter’s true skill level, FIP is not given nearly enough credit by the market. I was even more surprised that Krate was not significant, given that “It's difficult to maintain a high level of success without a K rate at least close to the league average” (Schoenfield, 2011). I was under the impression that power pitchers were desirable because of their ability to get outs without relying on the defense, and that more strikeouts translated to bigger paychecks. Lastly, I was extremely surprised that WHIP was not significant seeing as how my research showed that WHIP was the most important determinant for pitcher salary and team success. Therefore, I expected teams to value pitchers that do a good job of limiting baserunners. But because WHIP is influenced by how many hits a pitcher gives up, and hit rates are largely beyond a pitcher’s control, BBrate is a better indicator of a pitcher’s ability to limit baserunners since it is defense-independent. Therefore walk rate, along with FIP and strikeout rate, should be valued more by the starter market.
Reliever Model: Performing T-tests on this group showed that all the variables except for Krate, BBrate, FIP, and WLrate were significant at the 10% level, and both Krate and BBrate were very nearly significant at this level as well. As expected, WLrate does not have much of an effect on reliever salaries because relievers don’t get very many decisions. It was also not surprising that FIP didn’t play a significant role in relievers’ salaries since it is volatile in small sample sizes due to the weight it places on home runs, which allows a few bad innings to seriously harm a reliever’s FIP. Consequently, FIP is not always an accurate measure of a reliever’s performance. Based on the statistics I used, relievers seem properly valued.
Closer Model: Performing T-tests on this group showed that all the variables except for WHIP, KBBratio and YearsinMLB were significant at the 10% level. However, the T-stat for WHIP is close to significant, which makes sense given that closers are generally used to protect leads in close games, and allowing baserunners improves the opponents’ likelihood of a comeback. I was therefore surprised that K/BB ratio was not significant, since K/BB ratio is a good gauge of a pitcher’s control. Command is imperative for a closer protecting a narrow lead, as his mistakes are likely to cost his team wins, which is why K/BB ratio should be valued more.
Heteroskedsticity and Autocorrelation: Because the panel data is time-series and cross-sectional, there is a high likelihood of heteroskedasticity and autocorrelation errors. There’s also the possibility that teams sign players more for their intangibles rather than their actual skills (i.e. good clubhouse guys valued for their strong work ethics and leadership abilities), which would lead to omitted variable bias and thus yield inaccurate standard errors. To account for these possibilities I estimated the model with fixed effects and clustered by pitchers in the form of [xtreg lnsalary WHIP KBBratio ERA…YearsinMLBsquared, fe cluster(lahmanid)] to handle heteroskedasticty and autocorrelation, fixing my standard errors in the process.
 |
| For the most part, relievers and closers (like Koji Uehara) are properly valued |
Conclusion:
In conclusion, my data supports the accepted belief that aggregation is inappropriate among pitchers and that the free agent market values traditional and defensive independent stats. My data shows that relievers and closers seem to be properly valued. However, I did find several inefficiencies within the starting pitcher market, which undervalues strikeout rate, walk rate, and FIP—confirming my original belief that new fielding-independent stats would be undervalued.
As a defense-independent stat and predictable skill, strikeout rate is one of the best tools for evaluating pitchers. It has been shown to be correlated with ERA and is thus a good predictor of pitching success (Heretz, 2014). On top of that, strikeout rate has also been proven to be a significant factor for winning baseball games. In his study on the most important statistics for determining team success, Houser identified strikeouts per nine innings as having a strong effect on team success (Houser, 2005). His conclusion is supported by run-expectancy studies that show strikeouts are more harmful to the hitting team’s run-expectancy than other types of outs like ground outs, fly outs, and bunt outs (Tango, 2006). A strikeout is the most desirable type of out because it can’t be a “productive out” that advances runners (except for rare instances when the catcher drops the third strike). Accordingly, “elite value is easier to come by in the strikeout category. That is, the best pitchers in K% gain more value from being good at striking out hitters than the best pitchers in BB% or HR% gain from being good at preventing those events” (Kincaid, 2009). Put simply, strikeouts result in fewer opportunities to score runs, which is why the best pitchers (
Yu Darvish,
Felix Hernandez,
Justin Verlander) tend to have the best strikeout rates. Therefore, strikeout rate is worth pursuing.
Another defense-independent stat shown to be undervalued was walk rate. Though walks do not have as much of an effect on ERA as strikeouts do, they are still a significant determinant of ERA. On average, a walk will lead to .32 runs for the opposing team (Tango, 2006). Limiting free passes is important to preventing “big innings” in which the batting team scores multiple runs. Sure enough, a 2010 study by Dave Cameron showed a significant relationship between walks and winning percentage, revealing that 21 percent of a team’s winning percentage can be explained simply by walk rate. This relationship was confirmed by the standings, as more than half of the teams that made the playoffs between 1995 and 2009 had one of the ten best BB/9 ratios in baseball (Cameron, 2010). Therefore, a GM can improve his team’s odds of winning by finding pitchers with low walk rates (like
Cliff Lee,
Adam Wainwright, and
David Price).
Given that FIP is derived from strikeouts and walks (as well as home run rate, which the data also showed to be undervalued in the starter market), it’s not surprising that FIP is also undervalued in the market for starting pitchers. FIP has been shown to be a better predictor for future ERA than ERA itself and is arguably the best metric available for measuring a pitcher’s skill. FIP is also a strong determinant of team success. In fact, a recent study found FIP to be the best predictor of a team’s future record (Paine, 2014). Thus, FIP should be the first stat a general manager looks at because it can greatly aid his efforts to build a winning team. With the statistic still working its way into the mainstream, a general manager would be advised to take advantage of this inefficiency before the rest of baseball catches on to the power of FIP.
Essentially, finding the best pitchers boils down to acquiring the ones that best control the strike zone. But with so many teams employing statisticians and looking to exploit market inefficiencies, it’s becoming harder and harder to find them, especially since teams with high payrolls can pay more to exploit them. When inefficiencies are discovered, general managers must act on them immediately because the market will correct itself before long. When everyone’s looking for an edge, “Secrets are hard to keep…To play consistently successful Moneyball, you have to stay ahead of the curve, and that’s hard” (Cowen and Grier, 2011). Hard, but as
Billy Beane proved, not impossible.
Works Cited
Basco, Dan and Michael Davies. “The Many Flavors of DIPS: A History and
an Overview.”
Baseball-Reference. “Most
Valuable Player MVP Awards & Cy Young Awards Winners.”
(24 May 2005).
Cameron, David. “Do fewer walks
mean more wins?”
(18 May 2010).
Chen, Albert. “Mega television deals
are changing baseball’s economic landscape.”
(23 April 2012).
Costa, Gabe. “By The Numbers: A
Pitcher’s MVS (Most Valuable Stat).”
Cowen, Tyler and Kevin Grier.
“The Economics of Moneyball.”
Hakes, Jahn and Raymond Sauer. “An
Economic Evaluation of the Moneyball Hypothesis.”
Journal
of Economic Perspectives (Summer 2006): 173-185.
Heretz, Slava. “Battle of the Ks:
K/9, K/BB and K%.”
Houser, Adam. “Which Baseball
Statistic is the Most Important When Determining Team
Kincaid. “Why Strikeouts Matter
More for Pitchers.”
2009).
Krautmann, Anthony C., Elizabeth
Gustafson, and Lawrence Hadley. “A Note on the
Structural Stability of Salary Equations: Major
League Baseball Pitchers.” Journal of
Sports Economics (Feb. 2003): 56-63.
Moore, Jack. “The Most Convoluted
Statistic: ERA.”
Paapfly. “Pitching (almost)
always wins championships.”
2011).
Paine, Neil. “It’s All About the
Strike Zone.”
Sawchik, Travis. “Production
shift changes MLB free agency.”
Schoenfield, David. “Strikeouts
still the key to pitching success.”
(27 June 2011).
Skipper, James K. Jr. “Is
Pitching 75% of Baseball? Expert Opinions.”
Tango, Tom. “The Book—Playing The
Percentages In Baseball.”
(9 Feb. 2010).