 |
Greinke's LA numbers were better even though he stayed the same (Yahoo Sports)
|
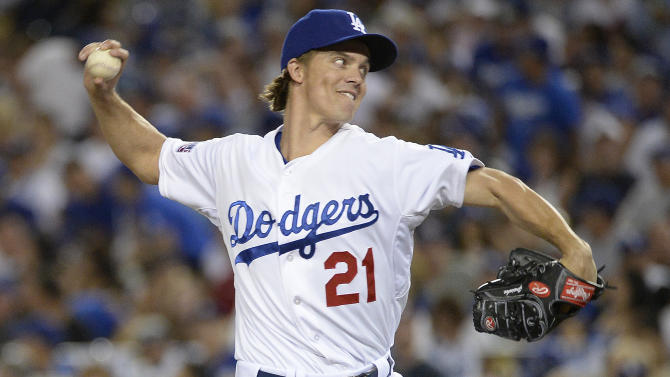
When Zack Greinke signed his six-year, $147 million contract with the Los Angeles Dodgers after the 2012 season, he became the highest-paid pitcher in baseball history in terms of annual salary. Now, after opting out of that deal and inking an even bigger one with the Arizona Diamondbacks, he’s the highest-paid player in baseball history in terms of annual salary.
How did Greinke get the same contract length and $60 million more at 32 than he he did at 29? By stringing together three straight dominant seasons in Los Angeles, the last of which was easily the best of his career and, in a normal year, would have earned him his second Cy Young. Greinke’s timing was impeccable, as he hit the open market after posting the lowest ERA (1.66) in 20 years and leading the majors in WHIP (0.84), winning percentage (.864), pitcher WAR (as calculated by Baseball-Reference), and ERA+ (225). His two years before that weren’t too shabby, either, as he posted sub-three ERAs and drew Cy Young votes both years.
But were his last three campaigns really that much better than the three that preceded his Dodgers contract? It depends which stats you use:
2010-2012: 41-25 W-L 3.83 ERA (106 ERA+) 1.22 WHIP .248 BA 8.4 bWAR
2013-2015: 51-15 W-L 2.30 ERA (156 ERA+) 1.03 WHIP .219 BA 17.5 bWAR
By traditional metrics, Greinke was a much better pitcher from ages 29-31 than he was from 26-28, which are supposed to be a player’s prime years. His ERA was a run and a half lower in the same number of innings, which explains why his bWAR more than doubled (B-R bases pitcher WAR off ERA and innings pitched). He won more games, lost fewer, and improved his WHIP and opponent batting average considerably.
Advanced metrics tell another story. Let’s start by looking at the two things pitchers can control, strikeouts and walks. I don’t include home runs because those are heavily influenced by park factors, temperature, air density, wind currents, and a bunch of other things beyond a pitcher’s sphere of influence:
2010-2012: 23.3 K% 6.2 BB%
2013-2015: 23.3 K% 5.4 BB%
Greinke’s strikeout rate remained identical, which one would expect given that nobody gains velocity as they get older. His walk rate improved a bit, which works out to be one fewer walk every two or three starts — hardly a big difference in the grand scheme of things.
People also believe pitchers have control over the type of hits they allow. Has Greinke’s distribution of batted balls become more favorable?
2010-2012: 20.3% LD 47.4% GB 32.3% FB 7.9 % IFFB
2013-2015: 21.8% LD 47.5% GB 30.8% FB 11.1% IFFB
Not really. Greinke’s groundball rate stayed the same, and he offset an increase in line drives with an increase in pop-ups. It’s weird that his line-drive rate went up, seeing as how he induced more soft contact and less hard contact over the past three years:
2010-2012: Soft 17.0% Med 54.7 % Hard 28.3%
2013-2015: Soft 19.3% Med 53.3% Hard 27.6%
Again, not much change, though there is some indication that he’s gotten better at generating weaker contact. Not enough to radically improve his results, mind you, or significantly alter his BABiP (keep that in mind for a minute).
While his ERA doesn’t reflect his stable peripherals, his FIP, xFIP, and SIERA do.
2010-2012: 3.16 FIP 3.17 xFIP 3.26 SIERA
2013-2015: 2.97 FIP 3.12 xFIP 3.23 SIERA
As you can see, fielding-independent metrics support the information above, suggesting Greinke was essentially the same pitcher over the past six years.
So why, then, are his Dodgers numbers so much shinier? Moving to Dodger Stadium (where he has a 2.00 career ERA) and a weaker division gave him a boost. Leaving behind a god-awful defense in Milwaukee helped. Having a better bullpen behind him didn’t hurt.
But also, a lot of it was just pure luck. Greinke was fairly unlucky in the three years before coming to Los Angeles, only to become one of the most fortunate pitchers in baseball during his time with the Dodgers. Greinke had the highest strand rate in baseball over the last three years, but from 2010-2012 he had one of the worst. Dodger Stadium and superior defense also helped him on balls in play. From 2010-2012, only Justin Masterson had a higher BABiP among pitchers who threw at least 600 innings. Over the last three years, however, Greinke had the third-lowest BABiP at .271 — roughly 30 points below the league average.
Greinke also had better luck on balls not in play, as in home runs. His HR/FB% dropped almost a full percentage point, which is substantial considering the league average is around 10% (Greinke’s mark from 2010-2012). Accordingly, his HR/9 rate improved by 16 percent. That works out to be only a handful of homers per season, but those long balls can make a serious dent in a pitcher’s ERA if they come with multiple guys on base.
Taking all this into consideration, Greinke is not a better pitcher now than he was three years ago. His park, fielders, and bullpen have made him look like a better pitcher, as has better luck, but at his core he’s the same guy. Here’s one more figure to prove it:
2010-2012: 13.6 fWAR (8th in pitcher fWAR)
2013-2015: 13.6 fWAR (8th in pitcher fWAR)
Greinke is getting paid to be the best pitcher in baseball, even though he’s not. After a few starts in the Arizona heat, that should become abundantly clear.
unvennasmiErie Shawn Biletnikoff Here
ReplyDeletekastmipullink