Showing posts with label Oakland. Show all posts

Monday, June 8, 2015

Sox Sweep, Starting to Hit

Hanley Ramirez has helped lead the charge for Boston (NESN)
The Red Sox earned their first sweep of the season yesterday, coming from behind to beat the Oakland A's 7-4 at Fenway Park.

Things were looking pretty bleak for Boston as "Sweet Caroline" faded from the stadium loudspeakers, for the Sox entered the bottom half of the eighth facing a 4-0 deficit. Their chances of winning at that point stood at a slim four percent. By inning's end, however, it was a whopping 97 percent. In the span of three outs the odds had completely flipped with Boston exploding for seven runs and eight hits against five different A's pitchers. When Tommy Layne preserved the lead to secure his first save since 2012, the Red Sox clinched just their second win of the season in a game where they trailed after seven innings.

The meltdown by the A's bullpen wasted a phenomenal start from the rookie Kendall Graveman, who blanked Boston through the first seven innings before Rusney Castillo finally touched him for a home run to lead off the bottom of the eighth. Bob Melvin promptly yanked Graveman, who exceeded 100 pitches during Castillo's at-bat, only to watch Oakland's seeming comfortable lead evaporate. When the dust settled at the end of the inning, Boston had gone from being down four to being up three, snatching victory out of the jaws of defeat and reminding everyone that no lead is ever truly safe at Fenway.

The big inning continued a recent resurgence for the Red Sox at the plate. After averaging a pitiful 2.83 runs per game during May, Sox hitters have appeared to turn the corner as of late. In the admittedly small sample size of seven June games, Boston's batted .300 and increased its average scoring output by nearly one run. It's no coincidence that this uptick in offense, combined with steadier pitching, helped the Sox go 5-2 last week.

In particular, the middle of the order has really stepped it up. Hanley Ramirez has rediscovered his early season power stroke with three home runs and nine RBI over his past 11 games. Mike Napoli's caught fire after a brutal start, slugging six home runs and compiling a 1.024 OPS since May 18th. Blake Swihart's also been better since struggling after his initial call up, notching hits in 9 of his last 11 games including his first career home run.

Dustin Pedroia and Xander Bogaerts aren't the only ones hitting anymore, but Boston's offense still isn't firing on all cylinders. David Ortiz and Pablo Sandoval are slumping badly, and Mookie Betts has underperformed the massive expectations he created with his monster spring training. If they can get going soon too, then the Red Sox will go on their first real sustained run of excellence of the year. If they hit like they're capable of hitting, then Boston will look like the first place team everyone thought they'd be coming into the season.

Monday, February 16, 2015

Giambi Goes Out With Whimper

Yep, that guy played major league baseball last year (Rant Sports)
Jason Giambi finally announced his retirement today at the age of 44.

I say finally because it seemed like Giambi retired years ago. He became a part-time player after leaving the Yankees via free agency in 2009 and, save for a brief resurgence with Colorado in 2011, was never again the impact hitter that he was during his days in Oakland and New York. Giambi played so sparingly over the past five seasons that it was just easy to forget about him unless you were a die-hard Rockies or Indians fan. Every now and then I'd see his name in the box score and think What? That guy's still playing?

Giambi hung around long past his expiration date, but he was hardly the first to do so. I'm just surprised a bat-first/only guy on the wrong side of 40 who couldn't hit, run, or field kept finding work.

And while those final years didn't add much to his counting stats, they did help him achieve several milestones. Giambi notched his 2,000th career hit on September 8th, 2013 against the New York mets. Leading off the bottom of the ninth, Giambi represented the tying run and was promptly removed for a pinch-runner. He cracked his 400th double the same year. There were also moments like these.

That's how the last act of Giambi's career played out; a lot of pinch-hitting and DH-ing and even more time spent on the bench. But during his heyday during the late 1990s and early 2000s, at the height of the steroid era, Giambi was an absolute terror. He had a beastly four-year peak from 1999-2002 when he batted .326/.452/.612 (177 OPS+) with a .448 wOBA. He was in the top-eight of the MVP voting every year, winning outright in 2000 and finishing runner-up to Ichiro Suzuki the following year. There were only two position players more valuable than Giambi during this time (according to fWAR): Barry Bonds and Alex Rodriguez.

Like Frank Thomas, another burly slugging first base/DH type, Giambi remained effective throughout his 30s but slipped as his body began to break down (probably a result of his admitted steroid use). Perhaps seduced by Yankee Stadium's short right field porch, he became more of a three-true outcomes kind of guy, especially once teams began employing defensive shifts against him. His BABiP, which had been above .310 every year from 1996-2002, fell below .295 in every one of his last dozen seasons, during which time Giambi batted a mere .238. Pretty shocking considering he nearly beat out Ichiro for the batting title in 2001.*.

*The same thing has more or less happened with Mark Teixeira, a first baseman who, like Giambi, signed a big long-term deal with New York, only to follow up a monster first season with several very good years before injuries, shifts, and a pull-happy approach wrecked him. 

Giambi's time in New York overlapped with the seven years where they failed to win the World Series. He signed on with them six weeks after Mariano Rivera's Game 7 meltdown in Arizona, only to depart the winter before New York hoisted its 27th championship banner. Giambi played 20 years, all in the wild card era, without ever winning a title, albeit through no fault of his own. He hit well in the postseason, flashing a .290/.425/.486 line with seven homers and 19 RBI in 45 games.

Interestingly, Giambi retires as the active leader in walks and hit by pitches. Few players had a better batting eye than the five-time All-Star, who led the league in free passes four times and posted a 15.3 BB% for his career. He also knew how to take one for the team, which he did 180 times throughout his career. In fact, only 10 players have ever been hit by more pitches.

Giambi, of course, was also a phenomenal power hitter and run producer. He topped 40 homers three times, 30 eight times, and 20 11 times. He went yard 440 times in all, good for 41st on the all-time list. He also came close to knocking in 1,500 runs, settling at 1,441 with seven seasons over the century mark (and another at 96). That's why Steinbrenner and Cashman paid him the big bucks.

Giambi's star may have faded away, but he had a damn good career, on par with David Ortiz, Carlos Delgado, and Jim Rice in terms of overall value. Had he been able to remain productive throughout his late 30s like Ortiz or if his peak had extended a few more years in either direction, we'd be talking about a legitimate Hall of Fame candidate. Instead, Giambi must settle for the Hall of Very Good, but that's still a pretty great place to be.

Saturday, November 29, 2014

Toronto Trades for Donaldson

Oakland unloaded its best player at the worst possible time (SFGate)
When you have not just the best third-baseman in baseball, but the sport's second most valuable position player over the past two years behind the one and only Mike Trout, and you have him under team control for four more years, and he's still only 29 years old, you'd be crazy to trade him, right? Especially when you're at a point on the win curve where one win could mean the difference between making the playoffs and playing golf in October. Unless you get so much in return that the trade is a can't miss opportunity, you thank your lucky stars that your late-blooming third-sacker unexpectedly evolved into one of the best all-around players in the game and wave him good bye when he hits the open market at 33.

For the Oakland A's to justify trading Josh Donaldson, their All-Star third baseman who finished fourth in the 2013 AL MVP race and eighth last year, they clearly needed to win such a trade. And while they're getting a four-for-one in their latest deal with the Toronto Blue Jays, I think they're probably looking at a loss, at least in the near future. The best they can hope for is a push.

The main piece Oakland gets in return for their All-Star third baseman is Brett Lawrie, who looks like a lost cause at this stage in his career. Since bursting onto the scene in 2011 with a .293/.373/.580 slash line, Lawrie's turned in three straight subpar, injury-plagued seasons. He's batted just .261/.316/.406 over the past three years with 34 home runs and 5.4 fWAR in 302 games, failing to deliver on the enormous promise he displayed as a rookie that drew comparisons to Ryan Braun. The soon-to-be 25 year-old is still young enough that an Alex Gordon or Donaldson-esque breakout might be looming, but right now there's not much to suggest such a transformation is coming. Moving from the Rogers Center to Oakland's Colisieum, a hitter's nightmare, won't help speed that process along.

The best-case scenario is that Lawrie puts it all together and becomes as good as Donaldson (it's pretty much impossible to be better), but even if he does the A's will only control him for three years rather than the four they had left with Donaldson. Granted, one player's age 25-27 seasons are more appealing than another's age 29-32 years, but Donaldson's already a finished product. Lawrie's still a project. Think of it this way; would you rather have the next three years of Jackie Bradley, Jr. (25 next year) or four more years of Andrew McCutchen (28)? Or how about Lawrie versus Evan Longoria (29)?

Lawrie's not Donaldson, and he's probably never going to be Donaldson because Gold Glove-caliber defenders with 30-homer pop are exceptionally rare these days. But the A's got more than Lawrie; they got three other players as well, all prospects. The most promising of those is Franklin Barreto, an 18 year-old shortstop who hit well in low-A ball last year (.399 wOBA, 141 wRC+ with 29 steals in 73 games). Barreto, Toronto's No. 5 prospect per Baseball America, could be something special, but he also won't be major league ready for at least a few more years. I'd feel a lot better about this deal for the A's if he becomes their franchise shortstop, but right now that's far from guaranteed.

The other two prospects are arms, neither of whom were considered among Toronto's 10 best prospects. One is lefty Sean Nolin, who's about to turn 25 but has only pitched one game in each of his two major league seasons. Even so, his solid minor league track record (3.06 ERA) suggests he's major league ready and could crack Oakland's rotation next year. Ditto Kendall Graveman, a righty and the other pitching prospect in this deal. Graveman's going to be 24 next year but shot up through Toronto's farm system, making his major league debut little more than a year after being drafted. He dominated at every minor league level last year with a 0.34 ERA at A ball, 2.23 in high-A, 1.50 at Double-A, and 1.88 in Triple-A. Just as playing in Oakland will hurt Lawrie, pitching there should only help Nolin and Graveman's development.
Lawrie leaves a lot to be desired (CBC Canada)
Looking at the swap from Oakland's perspective, my concern has more to do with the timing of it than what the A's got in return. Lawrie's an everyday third baseman: not a great one, but a major league regular at the very least. Barreto's the shortstop of the future, and on top of that Oakland nets a pair of major league ready arms to bolster its staff. If the A's were in rebuilding mode, this would be a fantastic move for them.

Only the A's are in no position to rebuild coming off last season's soul-crushing wild card game defeat. They were the best team in baseball in last year's first half, for crying out loud, and still mortgaged their future to acquire Jason Hammel and Jeff Samardzija from the Cubs (and then traded Yoenis Cespedes for Jon Lester and Jonny Gomes). You can't blame Billy Beane for wanting to restock the farm system a bit, but with that roster he should be focused on winning now, not five years from now. When you're on the cusp of your first World Series title since 1989, you don't trade your best player unless you're getting someone of similar value in return. Lawrie, Nolin, and Graveman combined probably won't provide as many wins as Donaldson will for the Blue Jays next year (Steamer says they'll produce 3.9 fWAR to Donaldson's 5.6 in 2015), and they take up three roster spots to Donaldson's one. Seven win players are incredibly rare and worth their weight in gold. Beane was lucky enough to have one, then crazy to trade him.

If you're the Blue Jays, though, you have to be excited with how your team's looking these days. Adding Donaldson to a lineup that already featured Jose Bautista, Edwin Encarnacion, Jose Reyes, and the recently acquired Russell Martin gives Toronto one of the best offenses in baseball (after they ranked fourth in runs and second in OPS among American League teams last year). The rotation isn't as formidable, but projects to be solid nonetheless. When you have a lineup like that, you can win plenty of games without top-shelf starting pitching.

Toronto's trying to be the top dog in an unstable AL East, and you have to commend the Jays for going for it. They know the time to win is now, with Boston, New York, and Tampa Bay all reeling from disappointing seasons, and they're doing all they can to end what is now the longest playoff drought in the four major American sports. Toronto's last two seasons have yielded disappointing results, but that hasn't stopped them from trusting their talent and doubling down on a championship-caliber core.

The A's could learn a thing or two.

Wednesday, November 19, 2014

A's Bank On Butler Bounceback

Butler brings an above average bat to Oakland (Fox4KC)
By signing Billy Butler to a three-year, $30 million engagement, the Oakland A's made their first major tweak to the roster responsible for one of the more memorable late season collapses in recent history (largely because the team stopped hitting). In Butler, they add a righthanded, middle of the order bat to fill the hole left by Yoenis Cespedes, who was traded to Boston last summer in exchange for Jon Lester and Jonny Gomes.

A lead-footed DH, Butler isn't the all-around talent that Cespedes is, but he'll at least replace Cespedes's bat. Not the power, mind you, but through a better OBP and similar run production. Check out how their numbers match up since 2012, Cespedes's rookie season:

Butler:     1,745 AB 55 HR 255 RBI.292/.358/.436 .794 OPS 117 OPS+ 36 Rbat
Cespedes: 1,616 AB 71 HR 262 RBI .263/.316/.464 .780 OPS 116 OPS+ 37 Rbat

Butler is also six months younger than Cespedes, and figures to be much cheaper over the next three years.

But since Butler adds no value whatsoever in the field or on the bases, Oakland needs him to bounce back from a dismal 2014 in which he managed only nine home runs, 66 RBI, and a .702 OPS (95 OPS+). Butler was actually below replacement level last year at -0.3 bWAR, and the cash-strapped A's can't afford to pay $10 million a year to someone with negative or zero value.

Billy Beane's betting that last year was an anomaly for Butler, who was a consistently above average hitter prior to 2014. Through his first seven seasons, he owned a .298/.364/.459 slash line (122 OPS+) while averaging 17 home runs, 35 doubles, and 80 RBI per season. That's essentially Pablo Sandoval production (better, actually) at only one-third the price.

Digging deeper, it actually makes loads of sense to forecast similar figures from Butler going forward. He's only going to be 29 next year, after all, and has been exceptionally durable, averaging 158 games per season over the past six. Furthermore, nothing alarming jumps out from Butler's batted ball data last year, though he did struggle against two seam fastballs. The best and simplest explanation I can find for Butler's down year was a slow start, as he had a sub-.600 OPS with only one home run through Memorial Day weekend. That would also explain why his walk rate plummeted, as flailing hitters tend to press at the plate and try to swing their way out of it. I suspect that's what happened to Butler, who's normally a patient hitter. Besides, he was fine from the end of May forward, batting .290/.339/.420 after May 28th. If that's what he hits next year, Oakland has to be happy with that.

The only obstacle that could thwart a return to form for Butler is his new home park, O.co Coliseum, which has been unkind to hitters with its deep power alleys and expansive foul territory. Butler flourished in Kaufmann Stadium--which was well-suited to his gap-power--where he batted .312/.372/.477 (.849 OPS) as a member of the Royals, as opposed to .278/.341/.426 (.766 OPS) everywhere else. His numbers in his new ballpark are almost identical to his road splits, as he has a .759 OPS in 130 career plate appearances there. That said, hitters typically perform better at home regardless of where they play, and Butler's Oakland numbers are likely suppressed by the A's strong pitching staffs in recent years. He won't have to face the likes of Sonny Gray, Jeff Samardzija, and Scott Kazmir in 2015.

Lastly, I like this deal because I think its terms are very fair, perhaps even favorable, for Oakland, who didn't even have to sacrifice a compensatory draft pick because Kansas City failed to give Butler a qualifying offer. Three years and $30 million is a pretty safe investment for an under-30 impact bat, and there's plenty of room for value here. Butler only needs to be worth in the neighborhood of four to five wins over the next three seasons to justify his salary, and he's certainly capable of that after compiling 13 bWAR from 2009 through 2013 (an average of 2.6 per season). Even if he doesn't get all the way back to being the hitter he was two years ago, his ability to provide above average hitting over 140-150 games should be plenty valuable. His presence makes Oakland's lineup deeper and more formidable, which should go a long way towards helping the A's get back to the postseason next fall.

Tuesday, October 21, 2014

Commemorating Chavez


Over the summer, at the height of Derek Jeter's much-ballyhooed retirement tour, Eric Chavez quietly retired, bringing an end to his 17-year major league career. While age and injuries reduced Chavez to a part-time player during the second half of his career, it's important to remember just how good he was during the first half. Had he just been able to stay healthy, his resume would probably be Hall of Fame worthy. As it is, it resembles something of a poor man's Scott Rolen; strong defense at third base complemented by good power and on-base ability, but a boatload of injuries later in the career. Rolen also happens to be Chavez's most similar batter through age 30, not surprisingly.

Drafted out of high school by the Oakland A's with the 10th pick of the 1996 draft, Chavez made his major league debut two years later. The year after that, he was Oakland's everyday third baseman. After a solid showing as a rookie, Chavez broke out in 2000 with 26 dingers and an .850 OPS, beginning a run of seven straight 20-homer seasons. He would max out at 34 in 2002, the year he won his only Silver Slugger and netted his highest MVP finish (14th) as part of the famed "Moneyball" A's squad. He produced nearly identical numbers the following year, led the league in walks with 95 in 2004, and enjoyed his fourth 100 RBI season in 2005. 2006 marked a bit of a decline for Chavez, as his average tumbled to .241, but he still posted a .351 OBP, smacked 22 home runs, and won his sixth straight Gold Glove.

Because he was basically replacement level for the last eight years of his career, I don't think people remember or appreciate just how good Chavez was at his peak. He was the American League's answer to Scott Rolen. From 2000 through 2005, when he averaged 30 homers and 98 RBI per year while winning five Gold Gloves, he was practically even in terms of value with Manny Ramirez and ahead of guys like Derek Jeter, Carlos Beltran, Miguel Tejada, Carlos Delgado, and Sammy Sosa. He never had that one monster MVP-caliber season or even made an All-Star team, but consistently stayed in the five-win range for half a decade. Had he been able to do that through the rest of the decade into his early 30s, would be discussing his Hall chances right now.

Because through 2006, his age-28 season, Chavez had already piled up 1,143 hits, 245 doubles, 212 home runs, 716 RBI, and 2,060 total bases. His 32.5 fWAR were within one of Chipper Jones at the same age and within two of Wade Boggs and Brooks Robinson. His 212 long balls ranked eighth of all third sackers through age 28, ahead of Dick Allen, Jim Thome, and Mike Schmidt, among others. His 716 RBI were seventh. And with six Gold Gloves already under his belt, Chavez appeared well on his way to Cooperstown.

Then, injuries. First it was debilitating back pain, followed later on by crippling knee ailments. After averaging 144 games per year from 1999 through 2006, Chavez never again played more than 115 games in a season. He played 90 games in 2007, 23 the year after that, and just eight in 2009. In 2010, his 13th and final year with Oakland, he suited up for only 33 games. His performance declined steadily during that time as various injuries took their toll. Worse, he became an enormous bust for the A's, collecting $45 million in player salaries over those final four years in Oakland, during which time he contributed -0.3 fWAR, damning him for all eternity as one of Billy Beane's worst investments.

Those four lost prime years effectively murdered whatever chance Chavez had the Hall, but incredibly they did not end his career. The Yankees, seeking backup for an aging Alex Rodriguez, scooped him up at a bargain bin price. Chavez was a non-factor in his first season with the Bronx (2011) but enjoyed a resurgent 2012 with 16 homers and an .845 OPS in 113 games. Chavez moved on to Arizona following New York's LCS elimination and continued to hit well there in spite of his old age, putting up an .810 OPS at age 35 and .795 at 36.

It was somewhat surprising, then, that Chavez retired midway through last season on July 30th. But the Diamondbacks were going nowhere and a knee injury had forced him to the disabled list. At 36, he was all done fighting his way back from injuries, so he forfeited the $1 million remaining on his contract and went home.

It's a shame we'll never know what Chavez would have accomplished had he stayed healthy. He was on track to be one of the 15, maybe even 10-best third basemen ever, at least on par with Rolen, Ken Boyer, and Ron Santo. Based on his early career trajectory, Chavez probably would have reached benchmarks such as 300 home runs and 2,000 hits, and may have added a few more Gold Gloves as well. As it is, his six Gold Gloves are tied with Buddy Bell and Robin Ventura for fourth-most all-time among third basemen, behind only Brooks Robinson, Mike Schmidt, and Rolen. His career .970 fielding percentage is the fifth-highest at the position.

Chavez is not a Hall of Famer, but for awhile he played like one. It's just too bad things didn't turn out differently, because by all accounts he was one of the game's classier, most respected players. Nobody deserves to have their career ravaged by injuries, but Chavez especially.

Monday, September 22, 2014

Lester Lights Out

Lester's been at the top of his game since arriving in Oakland (CBS)
The Oakland A's have been the subject of much derision lately because of their second half slide, falling from the top of their division to 10.5 games back of the Angels in six weeks. The A's have all but stopped hitting, and a lot of the blame for that has been laid at the feet of Billy Beane, who traded cleanup hitter and offensive force Yoenis Cespedes to Boston for Jon Lester and Jonny Gomes. Cespedes has mashed with the Sox, while Gomes's struggles have followed him out west (no homers and .540 OPS with Oakland).

But saying the trade made Oakland worse would be a fallacy. Lester and Gomes combined have given the A's 1.6 wins above replacement in their brief time with the club, while Cespedes has provided Boston with 1.2. Acknowledging that narrow difference is too negligible to say this trade came out in Oakland's favor with any certainty, at the very least it's been even.

Because while Gomes has given the A's nothing of value, Lester's stepped up to become the undisputed ace of his new team. As good as Lester was with Boston during the first half, he's been even more dominant with Oakland. In his 10 starts with the A's, all quality, he's delivered 69 and 2/3 innings (almost seven innings per turn) of 2.20 ERA-ball. Opponents have batted just /226/.272/.354 against him during that time, which explains how he's compiled a 1.06 WHIP since he came over to Oakland. He's also maintained a nifty strikeout to walk ratio of 64/16 (4/1) and posted an average GameScore of 63.

Lester's pitched as well as advertised, and the A's have gone 7-3 in his starts. It's hardly his fault that Oakland's lineup went into hibernation, or that Scott Kazmir and Sonny Gray have fallen off, or that the bullpen's been an absolute mess lately. Lester can only impact the team every five days, and he's done an excellent job of putting them in position to win. He's been money down the stretch, doing everything in his power to stop Oakland's slide even as the majority of his teammates have struggled.

He's been at the center of an epic collapse before, but if it happens again he's made damn sure well that he won't be the one to blame.


Saturday, August 2, 2014

The A's Amazing Rotation

A proven big-game pitcher, Lester will be central to Oakland's success
Going into this season, the two-time defending AL West champs appeared to have one of baseball's best rotations on paper. Then A.J. Griffin and Jarrod Parker, who together threw 397 innings of 3.90 ERA ball for Oakland in 2013, were lost for the season to Tommy John surgery before either one threw a pitch. Having 40 percent of the starting rotation evaporate before Opening Day would cripple most teams, but not the A's.

Through the Fourth of July, more than halfway through the season, Oakland was sporting the best record in baseball largely because of their pitching staff--the stingiest in the league. Then they shipped out a couple of top prospects to the Cubs for Jason Hammel and Jeff Samardzija, the former a quality arm and the latter a smoke-throwing borderline ace. The midseason additions fortified Oakland's already strong staff, making a great rotation even better.

Now, after dealing Yoenis Cespedes for Jon Lester and Jonny Gomes, Oakland's rotation looks unbeatable. It has to be considered one of if not the best in baseball alongside the collection of aces in Los Angeles, where Clayton Kershaw, Zack Grienke, Josh Beckett, Dan Haren and Hyun-jin Ryu deal for the Dodgers, and now Detroit, which on the same day added David Price to a staff already headed by Max Scherzer, Justin Verlander, Anibal Sanchez and Rick Porcello. What Oakland's rotation lacks in flashy names and hardware--the Tigers own the past three AL Cy Young winners and the Dodgers boast a pair in Kershaw and Greinke--they make up for in superior results. Check it out:

Tigers 3.82 ERA 1.26 WHIP 2.84 K/BB ratio 6.24 IP/GS .707 OPS 95 tOPS+ 97 sOPS+
Dodgers 3.19 ERA 1.16 WHIP 4.10 K/BB ratio 6.1 IP/GS .682 OPS 100 tOPS+ 90 sOPS+
Athletics 3.30 ERA 1.19 WHIP 2.74 K/BB ratio 6.04 IP/GS .665 OPS 107 tOPS+ 86 sOPS+

That Oakland has the lowest opponent OPS (raw and adjusted) of the three is actually very impressive considering the A's play in the American League and must contend with designated hitters rather than feeble-hitting pitchers. The Dodgers have a slight edge in ERA and WHIP, but since they're a National League team with a pitcher's haven for a home park that advantage must be discounted.

What's scary is that most of those numbers were compiled without Lester, Samardzija, and Hammel. Going forward, Oakland should be even better with a rotation that is quite literally overflowing with talent. In Lester and Sonny Gray the A's have a potent 1-2 punch with a pair of legit aces. Scott Kazmir and Samardzija--number ones on half the teams in baseball and strong number twos on the others--are mid-rotation guys in Oakland. The fifth starter is Hammel, who had a 2.98 ERA with the Cubs but has struggled since rejoining the American League.

Oakland's rotation is so loaded that there's no room for Tommy Milone or Jesse Chavez, both of whom excelled in the first half. Milone boasted  3.55 ERA and was 10-for-16 in quality starts before his demotion and subsequent trade following the Samardzija/Hammel acquisitions. With Lester on board, Chavez has been forced back to the bullpen despite strong numbers--3.44 ERA, 3.66 FIP and 2.90 K/BB ratio--in his first season as a regular starting pitcher. With Chavez having proved himself in the rotation and available to return should injury strike, Oakland has more than enough depth to last the next three months.

And with such a stacked rotation, the A's are well-positioned to hold off the Angels down the stretch and cinch their third straight division title. All those arms will make for a formidable opponent come October, when Bob Melvin can shorten the rotation and rely on his four excellent starters to get him through the postseason. Healthy and effective starting pitching is key to surviving a long regular season, but in short playoff series having elite starters is essential. Thanks to Billy Beane's wheeling and dealing, the A's now have four of them.

It's always impossible to predict who will emerge from the postseason crapshoot victorious, but the A's are as good a bet as any. 25 years removed from their most recent World Series title, they have the arms to win it all. Considering the talent Beane gave up to acquire them, they better.


Friday, August 1, 2014

Checking Out Cespedes

In Cespedes, Boston has one of baseball's most intriguing talents (SportsOutWest)
The Red Sox unloaded what felt like half their roster yesterday, trading away their two best starting pitchers, an ace reliever, their starting shortstop and half of their left field platoon, all after they'd already dealt two starting pitchers earlier in the week. But rather than netting a haul of prospects as many anticipated, Boston surprisingly got back established major league talent, which Ben Cherington explained as the first steps in retooling the roster to be competitive again in 2015.

Boston's shiniest new addition is Yoenis Cespedes*--an All-Star this year and winner of the last two home run derbies--acquired for Jon Lester and Jonny Gomes. Blessed with monster power, solid baserunning skills and a cannon for a right arm, Cespedes is one of the best all-around outfielders in baseball. A poor man's Giancarlo Stanton, if you will. And at 28, he's squarely in his prime, something the Red Sox can't say about too many of their players.

*(How much does it suck to be Cespedes right now? To be traded off the best team in baseball, an outfit that stands a great chance to win the World Series three months from now, to a last-place team with the third-worst record in the American League and no hope of making the playoffs. I'd be pissed).

In just his third major league season, Cespedes is still growing and maturing as a ballplayer, still making adjustments as he tries to translate his enormous raw abilities into the huge numbers they're capable of producing. While his offense has taken a step back since his rookie season, he's cut down on his strikeouts this year and has fashioned himself into a better defender (the Red Sox plan to try him in right with Shane Victorino on the DL again) Cespedes has the tools to be a star, an MVP even, but most think of him the way they think of Justin Upton or Desmond Jennings--a gifted outfielder who hasn't put it all together yet.

Cespedes came close in 2012, when he burst onto the scene as a 26 year-old rookie on a four-year, $36 million deal with the Oakland A's. He made an immediate impact, helping the A's go from 74 wins the year before his arrival to 94 wins and a division title in his very first season. Cespedes was a key offensive contributor who smashed 23 home runs, drove home 82, stole 16 bases in 20 attempts and batted .292/.356/.505, good for a .368 wOBA and 139 OPS+.

A four-win player, Cespedes would have been an easy choice for Rookie of the Year under normal circumstances, but 2012 was destined to be remembered for the historic rookie seasons of Mike Trout and Bryce Harper. With the vast majority of attention and praise showered on the younger phenoms, Cespedes was runner-up to Trout in the AL Rookie of the Year race--no shame in that--and earned a 10th place finish in the MVP voting as well. His future seemed bright, and he was so highly regarded at the time that some thought he'd win an MVP as soon as 2013.

Since then, however, his progression has stalled. He walked less and struck out more in 2013, exactly the opposite of what one hopes to see from a second-year big leaguer. While Cespedes still produced potent power numbers with 26 home runs, 80 RBI and a .202 ISO, his batting average tumbled more than 50 points while his OBP and SLG both dropped by over 60, resulting in a 124-point decline in OPS that effectively reduced him into a league average bat. Blame it on the dreaded sophomore slump, pitchers figuring him out or an early season thumb injury that sent him to the DL and may have affected his swing; whatever the reason, his follow-up campaign was a disappointment.

This year has been better, though still nowhere near as good as his impressive rookie campaign.  To be fair, his numbers are still suppressed somewhat by his 3-for-45 skid leading up to the All-Star Break, a funk from which he's recovered by batting .326 with three home runs and 11 RBI since the Midsummer Classic. But that's just the kind of hitter he is--streaky.

He's also somewhat injury prone, having spent time on the Disabled List in each of his first two seasons. He's remained healthy this year, playing all but six of Oakland's games before the trade and avoiding the Disabled List thus far (knock on wood). On pace to play a full season for the first time after missing 60 games with assorted injuries between 2012 and 2013, he'll likely finish the season with career highs in most offensive counting stats.

Of course, he's a good bet to improve upon those numbers next year provided he's still with the Sox. Moving away from the cavernous Coliseum to Fenway's friendly confines should boost his numbers considerably, especially his average and by extension his on-base percentage. No way he hits .250 again with a .300 OBP next year--he's probably closer to .275/.330. Those numbers could be conservative estimates, seeing as how he nearly batted .300 as a rookie and might become more patient with age as he gains better strike zone recognition. It's interesting that his career OPS has been almost 100 points higher in Oakland than on the road, but since most players hit better at home that doesn't mean much. Switching from one of baseball's worst parks for hitters to one of its best should, in theory, boost his stats considerably.

Letting Cespedes take aim at the Monster 81 times a year has to be a salivating prospect for the Red Sox. Cespedes was already worth three wins above replacement for the A's in three-fifths of a season. putting him on pace to be close to a five-win player this year. Assuming he at least stays the same, he should be good for another four to five wins next year, possibly more if he really takes off and hits his stride at Fenway, which should be easy for a fly ball hitter currently lifting over half his batted balls into the air, many of which will scrape off or clear the wall. It's easy to envision him hitting 30 homers for the first time, driving in close to 100 runs, and posting an OPS well over .800. He's not going to hit like Manny Ramirez, but he could have a season comparable to one of Jason Bay's better ones (remember him?).

Even if Cespedes stays what he is--a .250 hitter with 25 home run pop and a .300 OBP--that's still an upgrade over the Gomes/Daniel Nava tandem in left. He's also a better defender than either one and a better baserunner, too. Furthermore, he adds a hefty dose of power to a lineup, and in particular an outfield, that craves it. Boston currently ranks 12th in the American League in home runs and 13th in slugging, largely because its outfielders have combined to hit 14 home runs (Cespedes currently has 17). With Cespedes on board, you can bet that won't be the case next year.

But what about after next year? Cespedes is going to be an unrestricted free agent at the end of the 2015 season, and the Red Sox will not be able to offer him a qualifying offer. Suffice it to say, Cespedes is going to command a lot more than the $10.5 million he's making this year and next. As one of the few impact power bats availabe and a relatively young free agent at 30, Cespedes could easily land a nine-figure deal if her performs well in Boston. Given Red Sox ownership's recent aversion to spending lavishly for players on the wrong side of 30, it's hard to imagine them paying what it would take to keep him around.

But Boston's baseball ops can cross that bridge when they get to it. For now, they should be patting themselves on the back for getting almost a year and a half of Cespedes for Gomes and two months of Lester. Cespedes addresses their biggest hole--outfield power--and possesses the kind of game-changing talent that simultaneously improves their lineup and outfield defense. And he still has room to grow.

Cespedes is a fairly expensive project, but as far as projects go he's a pretty good one to have.

Saturday, July 12, 2014

A's Add Arms, Cubs Collect Chips

Jeff Samardzija makes Oakland's great rotation even better (ESPN)
"Going for it" has never really been part of Billy Beane's philosophy. He constructs his teams with the goal of regular season success in mind. They're built with depth and balance, designed to withstand the rigors of a long, grueling season. And they usually do, better than most. But without elite aces, top-shelf closers and dynamic power hitters, they are not built for the inherent randomness of postseason small sample sizes.

The playoffs are a different beast than the regular season. The margin for error is razor thin, and luck plays more of a role than we'd like to think. The goal is not to win 95 games in six months; it's to win 11 (or 12 if you're one of the wild card teams) in four weeks against the best competition baseball has to offer. Anyone can win a one-game playoff or five-to-seven game series. It truly is a crapshoot.

Beane knows this, and knows there's nothing anyone can do about it. He can't afford to chase the big-name power arms or sluggers that would likely put him over the top in the postseason. All he can do is build his team to make the playoffs and hope things fall into place. Hope they get the breaks and and the calls and the timely hits and big defensive plays.

Unfortunately for the Oakland A's, the stars haven't aligned for them in quite some time. It's been 25 years since Tony LaRussa guided Mark McGwire, Jose Canseco, Rickey Henderson, Dave Stewart, Dennis Eckersley and co. to Oakland's most recent World Series. For all the regular season success that Beane's teams have enjoyed in his 17 seasons as general manager of the A's--the six division titles, the seven playoff appearances, the two seasons with more than 100 wins and the six others with over 90--he's never won the big one. Incredibly, all of Oakland's wins have not produced a World Series championship in the most recent quarter-century. Beane's teams have never won a pennant, much less a World Series game.

This year, with Oakland cruising along to a third straight division title and likely the best record in baseball, Beane did something he rarely does. He traded young talent for established veteran starting pitching. Usually it's the other way around.

But with most teams still in the playoff hunt, Beane got a jump on the rest of baseball by making a big splash last weekend--nearly four weeks ahead of the trading deadline. He did business with another analytically-minded front office--that of Theo Epstein's and Jed Hoyer's Chicago Cubs--and was able to hammer out a deal more than a week before the All-Star Break. Dealing from a position of strength as one of the few seller's in a buyers' market, the rebuilding Cubs were able to pry away two top prospects and failed starter Dan Straily from the A's for a pair of talented starters; Jeff Samardzija and Jason Hammel, both of whom were enjoying excellent starts with the Cubs.

In Samardzija Oakland gets a very good pitcher, a 29 year-old flamethrower who struck out more than a batter per inning in 2012 and 2013. His 2.78 ERA would easily be the best mark of his career since becoming a regular starter in 2012, over a full run better than his previous best. None of his peripherals suggest he's been particularly lucky, so he's a good bet to sustain his performance going forward. Sure enough, he's been phenomenal in his first two starts with Oakland, allowing just four earned runs in 15 innings with a 10/1 K/BB ratio.

Hammel, with a 4.62 ERA (96 ERA+) in more than 1,000 big league innings, will never be mistaken for an ace, though he's pitched like one this year with a 2.98 ERA, 1.02 WHIP, and 4.52 K/BB ratio through his first 17 starts. Seeing as how Hammel is all of the sudden pitching the best baseball of his life at age 31 after many mediocre seasons, the Cubs were wise to sell high on him, though if he maintains his current K rate and walk rate--both career bests--he'll be very useful to the A's in the second half. His 3.32 FIP and xFIP indicate that he hasn't been especially lucky, though his .273 BABiP--34 points below his career rate--and 78.5 percent strand rate certainly suggest some good fortune. He's also on pace to set a career high in innings, which could lead to a fade down the stretch.

The trade gave the A's an abundance of arms. The stingiest team in the American League has so much pitching that they were forced to demote Tommy Milone, a crafty southpaw who hadn't lost a start since the beginning of May and carried a 3.55 ERA through the first week of July. On most teams he'd be a solid mid-rotation starter, but on the A's he isn't even good enough to crack the starting five.

As for the Cubs, they got quite a haul in outfielder Billy McKinney, Oakland's first-round draft pick last year, and shortstop Addison Russell--Oakland's first round selection the year before. Russell ranked as one of the sport's 15 best prospects coming into the season and has hit well in the minors, compiling an .897 OPS on the farm to date. McKinney has struggled in High-A Ball this year after raking Low-A last year but he's still only 19 and has plenty of time to figure things out. Even Straily, a decent starting pitcher before this year, could have some value if the Cubs get him right.

Both teams have to like this trade. The A's bolster their rotation and become the clear favorites to win not just the AL West, but the pennant as well. The early returns on the deal have been great, as Samardzija was terrific in his first two starts and Hammel pitched decently in his one. Meanwhile the future-minded Cubs unloaded Hammel, a free agent at year's end, and Samardzija, their most valuable trade chip. Arbitration-eligible this winter, he was due for a raise if the Cubs held on to him. In return they get two great pieces that figure to play a prominent role on the offensive juggernaut being assembled on the farm. They make the Cubs' already bright future even brighter and will likely be key contributors going forward for Chicago, who appear well-positioned to win a championship before the decade's out.

But if the Cubs win a title before Billy Beane does, then it will probably be because this trade went horribly wrong for him--like if Samardzija blows out his arm or Hammel regresses into the mediocre pitcher he was before this year. The AL West is a much more challenging division than the NL Central, which could also limit their effectiveness. Some have criticized this move as a redux of the ridiculed James Shields-Wil Myers trade from two offseasons ago, and it's possible that Beane just made a similar blunder. He hasn't had the best luck, you know.

Sunday, June 22, 2014

Sox Salvage Series Finale

Dustin Pedroia and the Sox won today despite a late inning meltdown by the bullpen
The Boston Red Sox narrowly avoided a four-game sweep at the hands of the Oakland A's today, escaping with a 7-6 extra-inning win over the team with the best record in baseball.

Boston's slumbering offense, which had scored two runs or fewer in seven of its previous eight games (and three in the eighth) woke up against soft-tossing Tommy Milone, scoring early and often to stake Jon Lester to an early lead. The Sox scored two in the first and one in the second, third, fifth, and eighth to build a 6-1 lead over the A's.

With Jon Lester in full control, the game appeared to be well in hand. But with two outs in the bottom of the eighth, Lester stumbled. The southpaw hit Craig Gentry with a pitch, then walked former teammate Jed Lowrie following Gentry's steal of second. With Lester fading after 111 pitches, John Farrell yanked him in favor of Burke Badenhop.

Lester left in line for his ninth win, entrusting Boston's five run lead to the bullpen for the final four outs. Badenhop was unable to get that third out, however, allowing consecutive singles to Yoenis Cespedes, Josh Donaldson, and Derek Norris. Three runs scored before Farrell returned to the mound to remove Badenhop and bring in Andrew Miller, who retired Coco Crisp to end the inning and preserve Boston's two-run advantage.

Dan Otero kept the Red Sox at bay in the top of the ninth, not that it was going to matter much with Koji Uehara coming in to protect Boston's lead. When Uehara's pitching, after all, a two-run edge feels insurmountable. Since the start of last season (postseason included), he'd allowed more than one earned run only two of his 119 appearances.

Today marked the third time. Alberto Callaspo grounded out to lead off the last of the ninth, then Stephen Vogt took Uehara deep for his second home run of the season. It didn't look like the run was going to matter when Nick Punto popped out to Jonathan Herrera for the second out.

Down to their last out, the A's went to their deep bench. Bob Melvin pinch-hit John Jaso for Gentry, a move that paid off when Jaso golfed the first pitch he saw from Uehara over the right field wall, tying the game with a blast of his own and sending the Coliseum fans into a frenzy. Ueheara rebounded to retire Lowrie and send the game to extra innings.

Melvin's next decision, calling upon Fernando Abad, didn't work out so well. Whereas pinch-hitting Jaso provided immediate returns, bringing in Abad backfired just as quickly. The first batter he faced, David Ortiz, went yard to put Boston back on top. Abad set down the next three Red Sox in order, but that run proved decisive when Oakland was unable to rally again in the bottom of the tenth. Uehara remained in the game and redeemed himself, retiring the A's 1-2-3 to seal Boston's 35th win of the season.

The Red Sox continue their west coast swing tomorrow in Seattle, where they'll send John Lackey to the hill. The Mariners will counter with Felix Hernandez, who's having another Cy Young caliber season and presents a challenge for Boston's woeful offense. It was nice to see them score seven runs and pound out 13 hits today, but they'll be lucky to get half as many tomorrow night against King Felix, who's been unhittable at Safeco this year (.201 opponent BA against him) and has traditionally pitched well against the Red Sox (7-2 with a 3.00 ERA). Lackey's going to have to bring his A game, but even if he does Boston will probably lose anyway given how poorly they've been swinging the bats lately, today's outburst notwithstanding.

Friday, May 2, 2014

Playing Moneyball: A Study on Inefficiencies in the Labor Market for MLB Pitchers

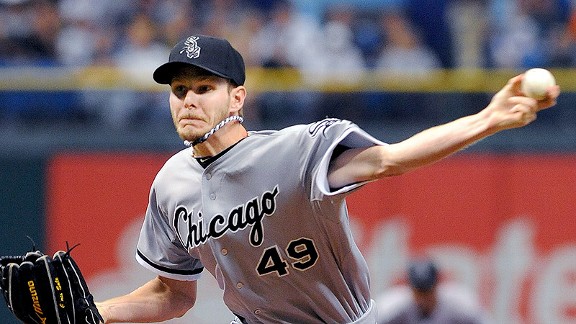
The best pitchers, like Chris Sale, have low walk rates and high strikeout rates
For my Econometrics final project, I investigated the determinants of pitcher salaries in an attempt to find measures of pitcher performance that were being undervalued by the market. It's pretty long and involves a lot of detailed explanation about the processes I used (like a lab report), so feel free to scroll down and skip ahead to my conclusions. Here are my findings:

Introduction:
This study investigates the role that certain statistics play in determining the salaries of major league starting pitchers, with the overarching goal of ultimately determining whether some common measures of pitcher performance are being valued properly. By doing so, I hope to reveal market inefficiencies that a general manager could take advantage of. First, I will provide background literature about some common popular and effective measures of pitching performance that I incorporated into my model. Then I will present the variables and statistics that make up my model, describing what each one means and why it is important. After that I will present the results of this study, finding the aggregate model and performing an F-Test to determine whether pooling is appropriate. I expect to confirm the theory that aggregation is inappropriate when analyzing pitchers because the structure of salary rewards varies significantly between the three main groups of pitchers: starters, relievers, and closers (Krautmann, 2003). Therefore, it is likely that I will need to find disaggregate models for each pitcher type as well. Then I can use T-tests to determine the significance of individual statistics on salary. This analysis will allow me to determine what inefficiencies there are, if any, in the labor market for pitchers that a general manager could exploit. I will then identify which statistics are not being valued properly and explain why, given their relationship with team success, they should be valued differently. My hypothesis is that some of the newer sabermetrics, specifically the fielding-independent ones that came into vogue in the early 2000s, will be undervalued whereas traditional metrics like the Triple Crown stats (wins, ERA, and strikeouts) will be overvalued.

Literature Review:
Hall of Fame owner and manager Connie Mack once said, “Pitching is 75 percent of baseball.” Others have placed an even greater premium on pitching, claiming it to be 90 percent of the game. While such assertions are clearly gross exaggerations, for winning is impossible without scoring runs or playing adequate defense, they still capture the essential belief that pitching is a very important—perhaps the most important—component of baseball. Pundits often say “pitching wins championships,” and generally this is true. Studies have shown runs allowed have a higher correlation with winning percentage than runs scored and that pitching is a better indicator of postseason success than hitting. In fact, only 25 of the 109 World Series champions (22.94 percent) had better hitting than pitching (Paapfly, 2011). It is widely accepted that good pitching is the key to a winning team, so much so that in a recent survey, 44 of 50 baseball experts ranked pitching as the most important factor in winning baseball (Skipper).

Thus, because pitching is valued so highly, free agent pitchers are hot commodities. The market for free agent pitchers is extremely competitive and is only becoming more competitive. Thanks to baseball’s recent influx of TV money and exploding revenues across the sport, teams are becoming richer than ever before. More teams can afford to spend money on free agents, thereby increasing the demand for them (Chen, 2012). But because teams have taken to locking up their young stars with below-market-rate contract extensions (thereby preventing them from reaching the open market in their primes) combined with less production from baseball’s older players  (the ones reaching free agency), the supply of available, impact free agents is becoming increasingly limited. With a smaller pool to choose from and more clubs actively pursuing free agents, teams, especially small market teams with tight budgets, need to be smarter than ever before about identifying which players are worth adding to their payroll (Sawchik, 2013).

The best way to do that is through statistical analysis, once an innovative idea now commonplace throughout the sport in large part because of Michael Lewis’s landmark book Moneyball and the success of analytical teams such as the A's, Red Sox, and Rays (Hakes and Sauer, 2006). And while there are numerous available statistics to measure a pitcher’s prowess, only a handful of them reflect his true skill set. This theory, known as Defense-Independent Pitching Statistics (DIPS), was popularized by Voros McCracken in 2001when his research revealed that the amount of balls that fall in for hits against pitchers do not correlate well across seasons. He concluded that pitchers have little control over balls in play—a conclusion that has since been verified by multiple studies within the sabermetric community—and argued for stats that leave such events out of their calculations. These statistics—walks, strikeouts, home runs, and hit by pitches—are designed to separate out defense and luck from measures of pitching performance, simply quantifying how well a pitcher controls the strike zone. Thus, they are widely believed to be best tools for evaluating pitchers. While not perfect, they help eliminate a lot of statistical white noise and are better predictors for future performance than previous ERA (Basco and Davies, 2010). Accordingly, I included defense-independent statistics such as walk rate (BB/9), home run rate (HR/9), strikeout rate (K/9), strikeout-to-walk ratio (K/BB), and Fielding Independent Pitching (FIP) to determine their effect on pitcher salaries. Since McCracken’s theory has been hailed by the sabermetric community as one of the most important baseball research discoveries in recent times (Bradbury, 2005), these variables should have some effect on salary. However, since DIPS is relatively new given the data set, which extends back to 1985, it’s possible that these variables won’t be significant.

These statistics do a much better job reflecting a player’s performance than traditional metrics, which are flawed because they rely too much on the performance of the pitcher’s teammates. When evaluating individual players, the goal should be to isolate him from his teammates as much as possible to get a clearer picture of his skill set, and traditional metrics don’t do this particularly well. Wins, for example, are heavily dependent on run support, sound defense, strong bullpen work, and a competent manager, none of which a pitcher can control. Historically, though, a high premium has been placed on wins, particularly for starting pitchers. Racking up 300 career wins has traditionally guaranteed entry into the Hall of Fame (unless you're Roger Clemens) and pitchers that win 20 games in a single season usually receive strong Cy Young consideration. For example, going back to 1985, 20 of the past 29 American League Cy Young recipients were 20-game winners (Baseball-Reference) . Because wins have traditionally been given a lot of weight when evaluating pitchers, I included Win-Loss ratio (defined as WLrate) in my model with the expectation that it would be a significant determinant of salary, even though it shouldn’t be.

Similarly, another old-school statistic, earned run average (ERA), has historically been considered the best measurement of a pitcher’s talent. As a measure of run prevention, it supposedly measures a pitcher’s ability to keep his team in the game. However, ERA has recently been exposed as a flawed statistic because what constitutes an error, and thus the difference between an earned run and an unearned run, is up to the discretion of the official scorer. Furthermore, ERA depends heavily on the defensive ability of the pitcher’s team, as balls that his fielders can’t reach aren’t counted as errors (Moore, 2009). But since ERA is still highly valued I included it in my model and expected it to be a significant determinant of salary.

The biggest determinant of ERA—a relatively new sabermetric called WHIP—is a better indicator of a pitcher’s effectiveness. Though it’s partially a team-statistic because it takes hits, which are susceptible to luck and defense, into account, WHIP is regarded as the most important determinant of pitcher salaries. Calculated as the sum of walks and hits divided by innings pitched, WHIP measures how often a pitcher allows runners to reach base. Since more runners lead to more runs scored by the opponent, WHIP is highly correlated with ERA (FanGraphs). In addition to increasing the other team’s run expectancy, baserunners force the pitcher to alter his delivery and pitch from the stretch, which typically reduces his velocity and makes his pitches easier to hit. Generally speaking, then, the most effective pitchers are the ones that prevent runners from reaching base. WHIP is also, according to a study done by economist Adam Houser, the most important statistic for determining team success (Houser, 2005), which explains why WHIP “is the chief determinant of how much the GM wants (a pitcher)…if the pitcher’s WHIP increased by .1, his salary will decrease by 37.7%...WHIP is the most important factor in determining a player’s salary” (Costa, 2012). Expecting WHIP to be a significant determinant of salary, I included it as a variable in my model to see if this was true.

When constructing my model I also had to take into account the different salary structures between the different subsets of pitchers. Past studies have proven that pitchers are paid differently because they are used differently, by which I mean used in different situations and for different lengths of time. History shows that starters, because they pitch the most and are inherently more valuable, make the most money, followed by closers (who are typically called upon to pitch in high leverage situations when the team is holding a lead in the ninth inning), then relievers. It’s also important to consider that statistics are not valued equally between the groups. For instance, wins are more important for starting pitchers and saves are more important for closers. Thus, it has been proven that using an aggregate model for analyzing salary determinants of pitchers is not appropriate and will lead to inaccurate conclusions (Krautmann, 2003). Later in this paper I will implement an F-test to see which model is more appropriate, but I expect to agree with Krautmann’s analysis that aggregation is inappropriate and will therefore need to construct disaggregate models.

Closers like Jonathan Papelbon (pictured) get paid differently than starters such as Cole Hamels
Data Description:
My basic model follows a semi-log function:
Ln(salary) = B0 + B1WHIP + B2KBBratio + B3ERA + B4HRrate + B5BBrate + B6Krate + B7WLrate + B8FIP + B9IP + B10YearsinMLB+ B11YearsinMLBsquared + e

All of the variables in this model are baseball statistics and the data used to calculate them came from the Lahman baseball database. I used career statistics because general managers typically pay attention to a player’s entire body of work instead of just his most recent season, which could have been a fluke year or been cut short by injury. I also used rate stats instead of raw totals to account for workload discrepancies and better compare the different pitcher types, since starters typically throw more innings and thus have superior counting stats. Lastly, I chose stats that could be applied to all three pitcher groups, leaving out metrics like saves which generally only apply to closers and wouldn’t be helpful in determining the salaries of starting pitchers or relievers. Each variable is described in detail below:

Ln(salary): My salary variable is the salary of the pitcher measured in dollars. I’m using the natural log of salary to reduce the effect of extreme outliers on the model.

WHIP: Walks and hits per innings pitched is regarded as one of most important pitching stats, especially as a determinant of salary. WHIP is a measure of the pitcher’s ability to limit baserunners and is calculated as (Walks + Hits)/Innings Pitched. However, because it takes hits into account and hits are influenced by the defense as well as luck, WHIP values are prone to fluctuating and are not defense-independent (FanGraphs).

KBBratio: The ratio of a pitcher’s strikeouts to walks (strikeouts/walks). The ratio of strikeouts to walks is a good measure of a pitcher’s command and is also defense-independent. The pitchers with the best ratios are usually aces (Pedro Martinez, Curt Schilling) and elite relievers/closers (Mariano Rivera, Craig Kimbrel) (Heretz, 2014).

ERA: Earned run average is one of baseball’s oldest and most popular pitching stats. It is calculated as (Earned Runs Allowed/Innings Pitched)*9 and reflects a pitcher’s ability to keep the other team from scoring. ERA does, however, depend on a number of factors beyond the pitcher’s control, such as the defense behind him as well as his bullpen. If a starter leaves runners on base when he comes out the game and the reliever that replaces him allows them to score, those runs will be charged to the starter because he put them there.

HRrate: Home run rate. Home runs per 9 innings pitched (9*HR/IP) is measures a pitcher’s ability to keep the ball in the park. This is crucial because a home run is an automatic score, making it the most efficient way for the other team to score runs. A home run can score up to four runs—depending on how many runners are on base—with one swing of the bat , thus making it a devastating weapon for the offense. A pitcher’s ability to limit the long ball, either by limiting mistake pitches over the plate or keeping the ball low in the zone, is vital to his success. However, it’s important to note that home run rates are not very stable and can vary depending on the ballpark and weather conditions. Nevertheless, home runs appear to be strongly linked to a pitcher’s skill set (Paine, 2014).

BBrate: Walks per 9 innings pitched (9*BB/IP) is a measure of a pitcher’s control and is also valued because it is a defense-independent stat. A lower walk rate means a pitcher has sharper command, is using his pitches efficiently, and is avoiding giving away free bases to batters.

Krate: Strikeouts per 9 innings pitched (9*K/IP). Strikeouts are important because they take pressure off the defense and are helpful for getting out of jams, when there are multiple baserunners with less than two outs and a batted ball has a greater probability of scoring a run. Usually the pitchers with the highest velocity or most unhittable pitches have the best strikeout rates. Like walk rate, K/9 is a defense-independent stat.

WLrate: A pitcher’s win-loss ratio is a general measure of a team’s success when he is on the mound (measured as Wins/Losses). It matters more for starting pitchers because relievers and closers typically only get a handful of wins and losses in a given season. However, a pitcher’s record is extremely dependent on the team’s offensive, defensive and bullpen abilities and fails to accurately reflect a pitcher’s ability.

FIP: Fielding Independent Pitching is probably the best defense-independent and pitching metric because it uses strikeouts, walks, and home runs to approximate ERA without the effect of a team's fielding ability, thus reflecting what a pitcher’s ERA should have looked like over a given time period (assuming that performance on balls in play and timing were league average). FIP actually correlates to future ERA better than ERA itself because it incorporates walk and strikeout rates (which are predictable), making it a superior indicator of future performance. It is calculated as FIP = ((13*HR) + (3*(BB + HBP)) - (2*K))/IP + constant. The constant’s purpose it to bring FIP onto an ERA scale and is generally around 3.20, which I used for my calculations. The logic behind FIP is that a walk is not as harmful as a home run and a strikeout has less impact than both, since it is only a way of specifying outs. FIP accounts for these kinds of differences, but because of the weight placed on home runs it is better suited for starters than relievers and closers, who pitch fewer innings and are thus more susceptible to fluky home run rates (FanGraphs).

IP: A pitcher’s innings pitched total is a good measure of his durability and is important for long relievers and starters. Long relievers need to be able to pitch multiple innings when the starter has been removed from the game early. Starting pitchers, as the best pitchers on the team (relievers are almost always failed starters), need to pitch deep into games to preserve the bullpen and prevent the manager from relying on less-effective pitchers.

YearsinMLB and YearsinMLBsquared: These two stats measure a pitcher’s experience. I included the squared variable to account for the fact that sometimes the relationship between experience and salary is not linear. In fact, it is usually the shape of a bell curve because a player’s salary is suppressed early in his career when he has little bargaining power, peaks when he reaches free agency and declines toward the end of his career when his durability and skills diminish. Squaring YearsinMLB presents experience as a linear relationship.

Dummy Variables: The lahman database provides data from the 1985 season through the 2012 season. I compiled my data using year dummies from 1985 through 2011 in both the aggregate and disaggregate models, omitting the 2012 season to avoid collinearity. In the aggregate model I included starters, closers, and relievers as dummy variables, but dropped them from the disaggregate models. I replaced them with the clause “if starter==1” for the disaggregate starter model, “if reliever==1” for the disaggregate reliever model, and “if closer==1” for the disaggregate closer model.

Except for the starter, closer, and reliever dummies, my disaggregate models used the same variables as my aggregate model. It is also important to note that I did not include pre-arbitration eligible players in the model because they are unable to negotiate their salaries, which are usually close to the league minimum regardless of their talent level. A player is typically arbitration-eligible after his third year in the league, at which point he and his team can negotiate salaries agreed upon by an arbitrator. It is generally believed that arbitration players are paid close to what they would make in free agency, which a player becomes eligible for after his sixth season. Therefore, in order to exclude the statistics of any pitcher who had not been in the league for 3 years I included an “if YearsinMLB>3” clause in each regression.

Lastly, in this data it was implied that the pitchers signed new deals every year.

Inexperienced pitchers like Jose Fernandez are excluded from the model
Results & Analysis:
My aggregate and disaggregate results are summarized in the following tables:

Table 1: Summary statistics
Variable
Observations
Mean
Stand. Dev.
Min
Max
lnsalary
5429
14.11337
1.144147
8.853665
17.0054
WHIP
8223
1.382458
.1423192
.8507463
2.543478
KBBratio
8223
1.909423
1.909423
.3823529
5.631579
ERA
8223
4.148665
.8213179
1.83913
13.5
HRrate
8223
.9356626
.2852701
.1615154
4.21875
BBrate
8223
3.534886
.9059441
.8059701
10.5859
Krate
8223
6.447733
1.55695
2.571429
14.01581
WLrate
8195
1.07005
.4840408
0
9
FIP
8223
4.394036
.6054866
2.104645
10.325
IP
8223
820.4798
746.6007
10.66667
5404.333
YearsinMLB
8223
7.872796
3.720746
4
27
YearsinMLBsq.
8223
75.82318
79.17193
16
729

Table 2: Regression Estimates of ln(salary) aggregated
Variable
Coefficient
T-stat
constant
15.31789
5.14*
WHIP
-2.027589
-2.96*
KBBratio
-.0488592
-0.28
ERA
-.6327169
-5.89*
HRrate
.3231463
.28
BBrate
.0890629
.30
Krate
.0527978
.27
WLrate
.023157
.30
FIP
-.1939498
-.24
IP
.005932
6.97*
YearsinMLB
.4000347
6.38*
YearsinMLBsquared
-.0140668
-12.02*
Observations
5420 (1192 clusters)

*means significant at the 10% level

Table 3: Regression Estimates of ln(salary) disaggregated

Starter
Reliever
Closer
Variable
Coefficient
T-stat
Coefficient
T-stat
Coefficient
T-stat
constant
14.85378
1.86*
15.46193
4.50*
32.54965
5.78*
WHIP
-.6996197
-.43
-2.452978
-3.13*
-1.979439
-1.39
KBBratio
-.3232786
-1.27
-.5813874
-1.74*
.2098917
.62
ERA
-.7952905
-3.62*
-.4778334
-3.96*
-.4136421
-1.81*
HRrate
.4035439
0.13
-1.53266
-1.87*
7.029692
2.68*
BBrate
-.2913997
-.38
-.4363638
-1.13
1.984496
2.76*
Krate
.2365876
.48
.3907144
1.51
-1.156296
-2.64*
WLrate
.2771034
2.31*
.045552
.56
-.1765087
-2.86*
FIP
.3178841
.15
.9299749
.93
-5.329965
-2.96*
IP
.001518
6.87*
.0007396
3.09*
.0018258
6.55*
YearsinMLB
.1290625
.84
.4015625
4.99*
.1144147
.68
YearsinMLBsquared
-.1039217
-9.45*
-.148052
-7.19*
-.0141254
-4.69*
Observations
2243 (522 clusters)
2161 (873 clusters)
1017 (343 clusters)
* means significant at the 10% level

In my aggregate model I performed T-tests on each variable. Using a 10% significance level with infinite degrees of freedom, the critical region was greater than 1.645 and less than      -1.645. Working under the null hypothesis that each variable equals zero and has no influence on salary, I was able to reject the null for the variables WHIP, ERA, IP, YearsinMLB and YearsinMLBsquared. By rejecting the null hypothesis I disproved the notion that these variables have no influential power and are not determinants of salary, but my inability to reject the other variables means I cannot disprove their lack of influential power. However, because my research showed that the other variables are likely to affect salary as well, I chose to include the variables BBrate, Krate, KBBratio, FIP, and WLrate in my model.

Aggregate vs. Disaggregate models: To determine if aggregation of the different pitcher types was necessary, I implemented an F-test on the pooled model at the 5% significance level. The resulting F-stat of 2.78 exceeded the critical value of F>1.00 (infinite degrees of freedom in the numerator and denominator), allowing me to reject the pooled model at both the 5% and 1% significance levels. Thus, I found strong evidence of structural differences and concluded aggregation was not appropriate. To make valid conclusions about determinants of salary I used disaggregate models for starters, relievers, and closers. These models allowed me to isolate how the variables influenced salary in each of the three markets and compare differences.

Starter Model: Performing T-tests on this group showed me that ERA, WLrate, IP, and YearsinMLBsquared were significant at the 10% level. The T-statistic for KBBratio suggested it may also be significant. This confirms my belief that traditional statistics have more influence on a starter’s salary than defense-independent statistics. Durable starting pitchers with low ERAs and good win-loss records fit into the traditional ace mold and are rewarded accordingly (i.e. Clayton Kershaw and CC Sabathia). W-L rate in particular is overvalued since it is too dependent on factors beyond the pitcher’s control and is not a good measure of his abilities.

I was very surprised that FIP’s T-stat was nowhere close to that of ERA, given that FIP is actually a better predictor of future ERA. Arguably the best statistic for measuring a starter’s true skill level, FIP is not given nearly enough credit by the market. I was even more surprised that Krate was not significant, given that “It's difficult to maintain a high level of success without a K rate at least close to the league average” (Schoenfield, 2011). I was under the impression that power pitchers were desirable because of their ability to get outs without relying on the defense, and that more strikeouts translated to bigger paychecks. Lastly, I was extremely surprised that WHIP was not significant seeing as how my research showed that WHIP was the most important determinant for pitcher salary and team success. Therefore, I expected teams to value pitchers that do a good job of limiting baserunners. But because WHIP is influenced by how many hits a pitcher gives up, and hit rates are largely beyond a pitcher’s control, BBrate is a better indicator of a pitcher’s ability to limit baserunners since it is defense-independent. Therefore walk rate, along with FIP and strikeout rate, should be valued more by the starter market.

Reliever Model: Performing T-tests on this group showed that all the variables except for Krate, BBrate, FIP, and WLrate were significant at the 10% level, and both Krate and BBrate were very nearly significant at this level as well. As expected, WLrate does not have much of an effect on reliever salaries because relievers don’t get very many decisions. It was also not surprising that FIP didn’t play a significant role in relievers’ salaries since it is volatile in small sample sizes due to the weight it places on home runs, which allows a few bad innings to seriously harm a reliever’s FIP. Consequently, FIP is not always an accurate measure of a reliever’s performance. Based on the statistics I used, relievers seem properly valued.

Closer Model: Performing T-tests on this group showed that all the variables except for WHIP, KBBratio and YearsinMLB were significant at the 10% level. However, the T-stat for WHIP is close to significant, which makes sense given that closers are generally used to protect leads in close games, and allowing baserunners improves the opponents’ likelihood of a comeback. I was therefore surprised that K/BB ratio was not significant, since K/BB ratio is a good gauge of a pitcher’s control. Command is imperative for a closer protecting a narrow lead, as his mistakes are likely to cost his team wins, which is why K/BB ratio should be valued more.

Heteroskedsticity and Autocorrelation: Because the panel data is time-series and cross-sectional, there is a high likelihood of heteroskedasticity and autocorrelation errors. There’s also the possibility that teams sign players more for their intangibles rather than their actual skills (i.e. good clubhouse guys valued for their strong work ethics and leadership abilities), which would lead to omitted variable bias and thus yield inaccurate standard errors. To account for these possibilities I estimated the model with fixed effects and clustered by pitchers in the form of [xtreg lnsalary WHIP KBBratio ERA…YearsinMLBsquared, fe cluster(lahmanid)] to handle heteroskedasticty and autocorrelation, fixing my standard errors in the process.

For the most part, relievers and closers (like Koji Uehara) are properly valued
Conclusion:
In conclusion, my data supports the accepted belief that aggregation is inappropriate among pitchers and that the free agent market values traditional and defensive independent stats. My data shows that relievers and closers seem to be properly valued. However, I did find several inefficiencies within the starting pitcher market, which undervalues strikeout rate, walk rate, and FIP—confirming my original belief that new fielding-independent stats would be undervalued.

As a defense-independent stat and predictable skill, strikeout rate is one of the best tools for evaluating pitchers. It has been shown to be correlated with ERA and is thus a good predictor of pitching success (Heretz, 2014). On top of that, strikeout rate has also been proven to be a significant factor for winning baseball games. In his study on the most important statistics for determining team success, Houser identified strikeouts per nine innings as having a strong effect on team success (Houser, 2005). His conclusion is supported by run-expectancy studies that show strikeouts are more harmful to the hitting team’s run-expectancy than other types of outs like ground outs, fly outs, and bunt outs (Tango, 2006). A strikeout is the most desirable type of out because it can’t be a “productive out” that advances runners (except for rare instances when the catcher drops the third strike). Accordingly, “elite value is easier to come by in the strikeout category. That is, the best pitchers in K% gain more value from being good at striking out hitters than the best pitchers in BB% or HR% gain from being good at preventing those events” (Kincaid, 2009). Put simply, strikeouts result in fewer opportunities to score runs, which is why the best pitchers (Yu Darvish, Felix Hernandez, Justin Verlander) tend to have the best strikeout rates. Therefore, strikeout rate is worth pursuing.

Another defense-independent stat shown to be undervalued was walk rate. Though walks do not have as much of an effect on ERA as strikeouts do, they are still a significant determinant of ERA. On average, a walk will lead to .32 runs for the opposing team (Tango, 2006). Limiting free passes is important to preventing “big innings” in which the batting team scores multiple runs. Sure enough, a 2010 study by Dave Cameron showed a significant relationship between walks and winning percentage, revealing that 21 percent of a team’s winning percentage can be explained simply by walk rate. This relationship was confirmed by the standings, as more than half of the teams that made the playoffs between 1995 and 2009 had one of the ten best BB/9 ratios in baseball (Cameron, 2010). Therefore, a GM can improve his team’s odds of winning by finding pitchers with low walk rates (like Cliff Lee, Adam Wainwright, and David Price).

Given that FIP is derived from strikeouts and walks (as well as home run rate, which the data also showed to be undervalued in the starter market), it’s not surprising that FIP is also undervalued in the market for starting pitchers. FIP has been shown to be a better predictor for future ERA than ERA itself and is arguably the best metric available for measuring a pitcher’s skill. FIP is also a strong determinant of team success. In fact, a recent study found FIP to be the best predictor of a team’s future record (Paine, 2014). Thus, FIP should be the first stat a general manager looks at because it can greatly aid his efforts to build a winning team. With the statistic still working its way into the mainstream, a general manager would be advised to take advantage of this inefficiency before the rest of baseball catches on to the power of FIP.

Essentially, finding the best pitchers boils down to acquiring the ones that best control the strike zone. But with so many teams employing statisticians and looking to exploit market inefficiencies, it’s becoming harder and harder to find them, especially since teams with high payrolls can pay more to exploit them. When inefficiencies are discovered, general managers must act on them immediately because the market will correct itself before long. When everyone’s looking for an edge, “Secrets are hard to keep…To play consistently successful Moneyball, you have to stay ahead of the curve, and that’s hard” (Cowen and Grier, 2011). Hard, but as Billy Beane proved, not impossible.

Works Cited

Basco, Dan and Michael Davies. “The Many Flavors of DIPS: A History and an Overview.”


Baseball-Reference. “Most Valuable Player MVP Awards & Cy Young Awards Winners.”


Bradbury, JC. “Another Look at DIPS.” http://www.hardballtimes.com/another-look-at-dips1/

     (24 May 2005).

Cameron, David. “Do fewer walks mean more wins?”


     (18 May 2010).

Chen, Albert. “Mega television deals are changing baseball’s economic landscape.”


     (23 April 2012).
    
Costa, Gabe. “By The Numbers: A Pitcher’s MVS (Most Valuable Stat).”


Cowen, Tyler and Kevin Grier. “The Economics of Moneyball.”


FanGraphs. “FIP.” http://www.fangraphs.com/library/pitching/fip/ (19 April 2014).

FanGraphs. “WHIP.” http://www.fangraphs.com/library/pitching/whip (24  April 2014).

Hakes, Jahn and Raymond Sauer. “An Economic Evaluation of the Moneyball Hypothesis.”

     Journal of Economic Perspectives (Summer 2006): 173-185.

Heretz, Slava. “Battle of the Ks: K/9, K/BB and K%.”


Houser, Adam. “Which Baseball Statistic is the Most Important When Determining Team

     Success?” http://www.iwu.edu/economics/PPE13/houser.pdf (2005).

Kincaid. “Why Strikeouts Matter More for Pitchers.”


     2009).

Krautmann, Anthony C., Elizabeth Gustafson, and Lawrence Hadley. “A Note on the 

     Structural Stability of Salary Equations: Major League Baseball Pitchers.” Journal of 

     Sports Economics (Feb. 2003): 56-63.

Moore, Jack. “The Most Convoluted Statistic: ERA.”


Paapfly. “Pitching (almost) always wins championships.”


     2011).

Paine, Neil. “It’s All About the Strike Zone.”


Sawchik, Travis. “Production shift changes MLB free agency.”


Schoenfield, David. “Strikeouts still the key to pitching success.”


     (27 June 2011).

Skipper, James K. Jr. “Is Pitching 75% of Baseball? Expert Opinions.”


Tango, Tom. “The Book—Playing The Percentages In Baseball.”


     (9 Feb. 2010).